Stability condition on van der Waals isotherms
Code: #11A-000
File: apps/van_der_waals/stability.ipynb
Run it online: ![]()
The aim of this notebook is to visualize the \(\left(\frac{\partial p}{\partial v}\right)_{T,N} < 0\) stability condition on van der Waals isotherms.
Interface
The main interface (main_block_11A_000) is divided in two HBox: top_block_11A_000 and bottom_block_11A_000. bottom_block_11A_000 contains of 2 bqplot Figures: fig_11A_001 and fig_11A_002.
[1]:
from IPython.display import Image
Image(filename='../../static/images/apps/11A-000_1.png')
[1]:
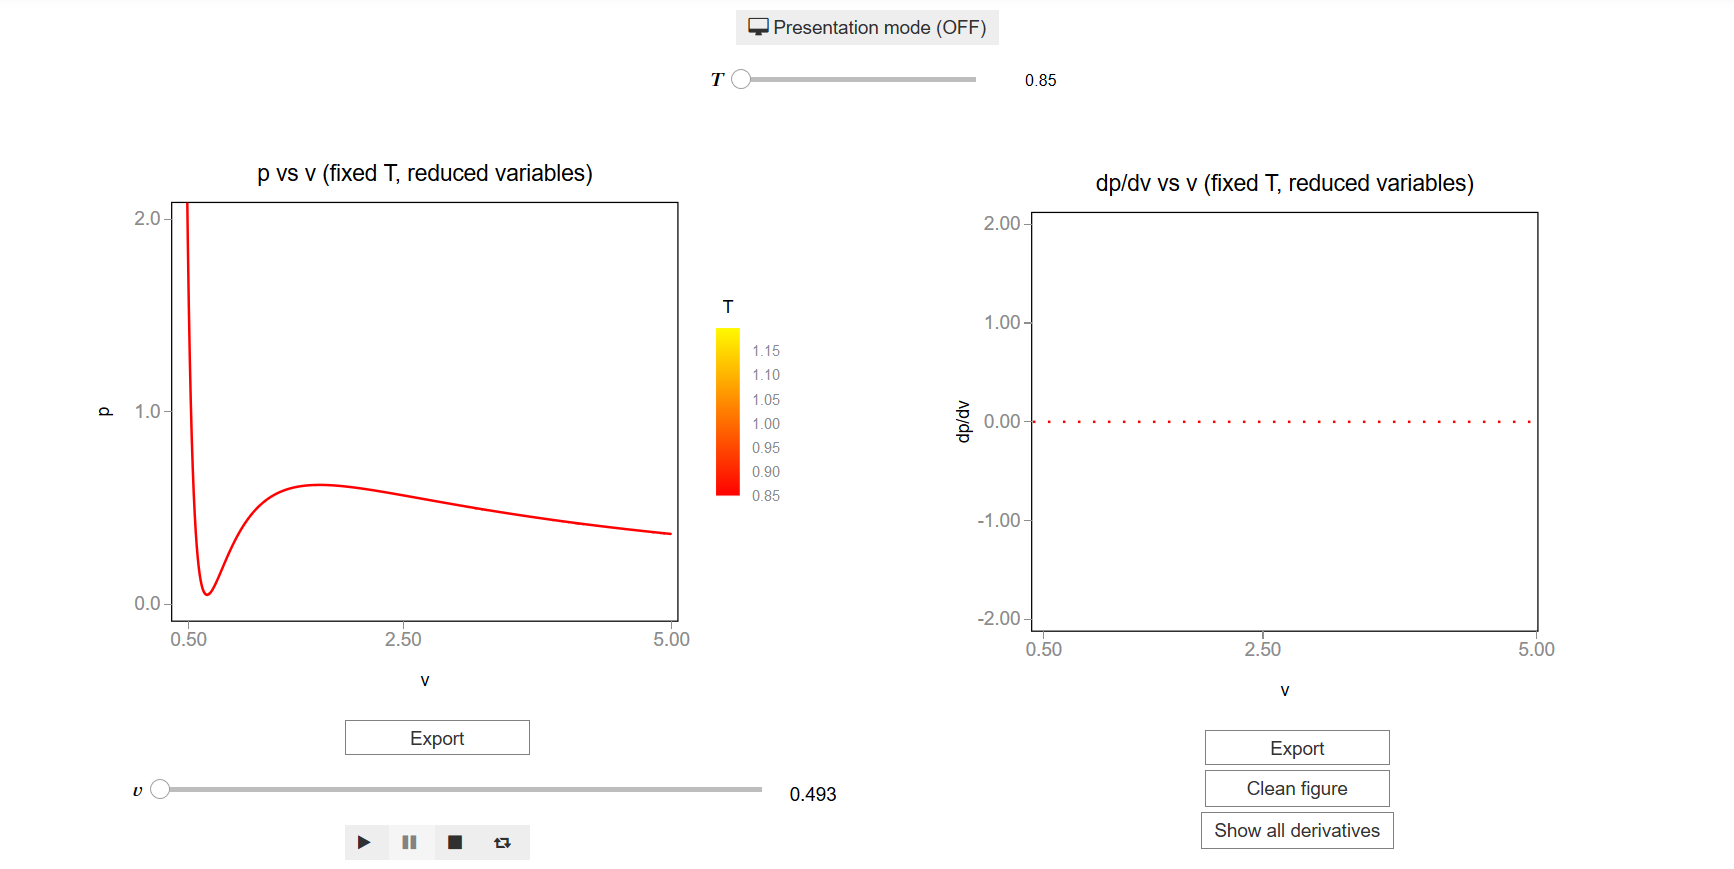
The slider T_slider updates the values of \(T\) which updates the lines of fig_11A_001 and fig_11A_002.
[2]:
Image(filename='../../static/images/apps/11A-000_2.png')
[2]:
CSS
A custom css file is used to improve the interface of this application. It can be found here.
[3]:
from IPython.display import HTML
display(HTML("<head><link rel='stylesheet' type='text/css' href='./../../static/custom.css'></head>"))
display(HTML("<style>.container { width:100% !important; }</style>"))
display(HTML("<style>.widget-label { display: contents !important; }</style>"))
display(HTML("<style>.slider-container { margin: 12px !important; }</style>"))
display(HTML("<style>.jupyter-widgets { overflow: auto !important; }</style>"))
Packages
[4]:
from bqplot import *
import bqplot as bq
import bqplot.marks as bqm
import bqplot.scales as bqs
import bqplot.axes as bqa

import ipywidgets as widgets

import urllib.parse
import webbrowser

import sys
Physical functions
This are the functions that have a physical meaning:
get_relative_isothermsget_derivative_y_by_x
[5]:
def get_relative_isotherms(v_range, T_range):
    """This function calculates the theoretical p(v, T) plane
        (in reduced coordinates) according to van der Waals
        equation of state from a given range of volumes
        and tenperatures.

    Args:
        v_range: An array containing the values of v
        (in reduced coordinates)for which the isotherms must be
        calculated.\n
        T_range: An array containing the values of T
        (in reduced coordinates)for which the isotherms must be
        calculated.\n


    Returns:
        isotherms: A list consisted of numpy arrays containing the
        pressures of each isotherm.
    """

    isotherms = []

    for T in T_range:
        p_R = []
        for v in v_range:
            val = (8.0/3.0*T/(v - 1.0/3.0) - 3.0/v**2)
            p_R = np.append(p_R, val)

        isotherms.append(p_R)

    return isotherms
[6]:
def get_derivative_y_by_x(y_values, x_values):
    """This function calculates the derivative an y array
    with respect to an x array calculated with the difference quotient.

    Args:
        y_values: An array containing the values of y.\n
        x_values: An array containing the values of x.\n


    Returns:
        der: An array containing the values of the
        derivative of y_values with respect to x_values.
    """

    der = []


    for i in range(len(x_values)):

        x = x_values[i]
        y = y_values[i]

        d = []

        l = np.size(y)

        for j in range(1, l):
            d.append((y[j] - y[j-1])/(x[j] - x[j-1]))

        der.append(d)

    return der
Main interface
[ ]:
v_values = np.linspace(0.4, 5.0, 500)
T_values = [0.85, 0.9, 0.95, 1.0, 1.05, 1.1, 1.15, 1.2]

p_values = get_relative_isotherms(v_values, T_values)

################################
######TOP BLOCK#################
################################

top_block = widgets.VBox(
    [],
    layout=widgets.Layout(align_items='center')
)

T_slider = widgets.SelectionSlider(
    options= T_values,
    value=T_values[0],
    description=r'\( T \)',
    disabled=False,
    continuous_update=True,
    orientation='horizontal',
    readout=True,
    layout = widgets.Layout(
        width = '300px',
        height = 'auto',
        margin='0 0 0 50px'
    )
)

T_slider.observe(change_tenperature, 'value')

change_view_button = widgets.ToggleButton(
    value=False,
    description='Presentation mode (OFF)',
    disabled=False,
    button_style='',
    tooltip='',
    icon='desktop',
    layout=widgets.Layout(
        width='initial',
        align_self='center'
    )
)

change_view_button.observe(change_view, 'value')

top_block.children = [
    change_view_button,
    T_slider
]

################################
######BOTTOM BLOCK##############
################################

bottom_block = widgets.HBox(
    [],
    layout=widgets.Layout(
        width='100%',
        align_items='center'
    )
)

dense_v_values = np.linspace(min(v_values), max(v_values), 10000)
dense_p_values = get_relative_isotherms(dense_v_values, T_values)

dense_v_values_filtered = []
dense_p_values_filtered = []

dense_v_values_inverted = []
dense_p_values_inverted = []

dense_v_values_rounded = []

for i in range(len(T_values)):

    i_in_range, = np.where(dense_p_values[i] < 2.0)

    dense_v_values_filtered.append(np.take(dense_v_values, i_in_range))
    dense_p_values_filtered.append(np.take(dense_p_values[i], i_in_range))
    dense_v_values_rounded.append(np.round(dense_v_values_filtered[i], 3))

v_text = widgets.HTML(
    value="<p>" + str(dense_v_values_rounded[T_slider.index][i]) + "</p>",
    layout = widgets.Layout(
        height='auto',
        margin='8px 0 0 10px',
        width='initial'
    )
)

der = get_derivative_y_by_x(dense_p_values_filtered, dense_v_values_filtered)

v_slider = widgets.IntSlider(
    min=0,
    max=len(der[T_slider.index])-1,
    value=0,
    description=r'\( v \)',
    disabled=False,
    continuous_update=True,
    orientation='horizontal',
    readout=False,
    layout = widgets.Layout(width = '75%', height='auto', margin='0 0 0 100px')
)

v_slider.observe(update_tracer, 'value')
v_slider.observe(update_text, 'value')

play = widgets.Play(
    interval=1,
    value=0,
    min=0,
    max=v_slider.max,
    step=1,
    description="Press play",
    disabled=False
)

widgets.jslink((play, 'value'), (v_slider, 'value'));

scale_x = bqs.LinearScale(min = min(v_values), max = max(v_values))
scale_y = bqs.LinearScale(min = 0.0, max = 2.0)

color_scale = bqs.ColorScale(
    colors = ['#FF0000', '#FFfa00'],
    min=min(T_values),
    max=max(T_values)
)

axis_x_001 = bqa.Axis(
    scale=scale_x,
    tick_format='.2f',
    tick_style={'font-size': '15px'},
    tick_values = [0.5, 2.5, 5.0],
    grid_lines = 'none',
    grid_color = '#8e8e8e',
    label='v',
    label_location='middle',
    label_style={'stroke': 'black', 'default-size': 35},
    label_offset='50px'
)

axis_y_001 = bqa.Axis(
    scale=scale_y,
    tick_format='.1f',
    tick_style={'font-size': '15px'},
    tick_values = [0.0, 1, 2],
    grid_lines = 'none',
    grid_color = '#8e8e8e',
    orientation='vertical',
    label='p',
    label_location='middle',
    label_style={'stroke': 'red', 'default_size': 35},
    label_offset='50px'
)

axis_color = bqa.ColorAxis(
    label = 'T',
    scale=color_scale,
    tick_format='.2f',
    orientation='vertical',
    side='right'
)

fig_11A_001 = Figure(
    title='p vs v (fixed T, reduced variables)',
    marks=[],
    axes=[axis_x_001, axis_y_001, axis_color],
    animation_duration=0,
    legend_location='top-right',
    background_style= {'fill': 'white',  'stroke': 'black'},
    fig_margin=dict(top=70, bottom=75, left=80, right=100),
    toolbar = True,
    layout = widgets.Layout(width='85%')
)

lines_11A_001 = bqm.Lines(
    x = v_values,
    y = p_values,
    scales = {'x': scale_x, 'y': scale_y, 'color': color_scale},
    opacities = [1.0] + [0.0 for i in range(len(T_values)-1)],
    visible = True,
    color = T_values,
)

tracer_11A_001 = bqm.Scatter(
    name = '',
    x = [0.0],
    y = [0.0],
    scales = {'x': scale_x, 'y': scale_y},
    opacity = [1.0],
    visible = False,
    colors = ['#2807a3'],
)

fig_11A_001.marks = [
    lines_11A_001,
    tracer_11A_001
]

scale_x_002 = bqs.LinearScale(min = 0.0, max = 2.0)
scale_y_002 = bqs.LinearScale(min = -2.0, max = 2.0)

axis_y_002 = bqa.Axis(
    scale=scale_y_002,
    tick_format='.2f',#'0.2f',
    tick_style={'font-size': '15px'},
    tick_values = [-2, -1, 0, 1, 2],
    grid_lines = 'none',
    grid_color = '#8e8e8e',
    orientation='vertical',
    label='dp/dv',
    label_location='middle',
    label_style={'stroke': 'red', 'default_size': 35},
    label_offset='50px'
)

fig_11A_002 = Figure(
    title='dp/dv vs v (fixed T, reduced variables)',
    marks=[],
    axes=[axis_x_001, axis_y_002],
    animation_duration=0,
    legend_location='top-right',
    background_style= {'fill': 'white',  'stroke': 'black'},
    fig_margin=dict(top=70, bottom=75, left=80, right=100),
    toolbar = True,
    layout = widgets.Layout(width='85%')
)

lines_11A_002 = bqm.Lines(
    x = [0.4],
    y = [1.0],
    scales = {'x': scale_x, 'y': scale_y_002, 'color':color_scale},
    opacities = [1.0],
    visible = True,
    color = T_values,
)

zero_11A_002 = bqm.Lines(
    x = v_values,
    y = [0.0 for v in v_values],
    scales = {'x': scale_x, 'y': scale_y_002},
    opacities = [1.0],
    visible = True,
    colors = ['#FF0000'],
    line_style = 'dotted'
)

fig_11A_002.marks = [
    zero_11A_002,
    lines_11A_002
]

restart_button = widgets.Button(
    description='Clean figure',
    disabled=False,
    button_style='',
    tooltip="",
    layout = widgets.Layout(height='auto')
)

restart_button.on_click(restart_derivative)

show_all_button = widgets.Button(
    description='Show all derivatives',
    disabled=False,
    button_style='',
    tooltip="",
    layout = widgets.Layout(height='auto', width='initial')
)

show_all_button.on_click(show_all_derivatives)

prepare_export_fig_11A_001_button = widgets.Button(
    description='Export',
    disabled=False,
    button_style='',
    tooltip='',
)

prepare_export_fig_11A_001_button.on_click(prepare_export)

prepare_export_fig_11A_002_button = widgets.Button(
    description='Export',
    disabled=False,
    button_style='',
    tooltip='',
)

prepare_export_fig_11A_002_button.on_click(prepare_export)

slider_box = widgets.HBox([
    v_slider, v_text
    ],
    layout=widgets.Layout(
        height='auto',
        width='100%',
        align_items='center'
    )
)

bottom_block.children = [
    widgets.VBox([
        fig_11A_001,
        prepare_export_fig_11A_001_button,
        slider_box,
        play
    ],
    layout=widgets.Layout(
        height='auto',
        width='50%',
        align_items='center'
    )
    ),
    widgets.VBox([
        fig_11A_002,
        prepare_export_fig_11A_002_button,
        restart_button,
        show_all_button
    ],
    layout=widgets.Layout(
        height='auto',
        width='50%',
        align_items='center'
    )
    )
]

main_block_11A_000 = widgets.VBox(
    [],
    layout=widgets.Layout(align_items='center')
)

main_block_11A_000.children = [
    top_block,
    bottom_block
]

figures = [
    fig_11A_001,
    fig_11A_002
]

main_block_11A_000