Van der Waals isotherms in 3D
Code: #116-000
File: apps/van_der_waals/p_v_T_3D.ipynb
Run it online: ![]()
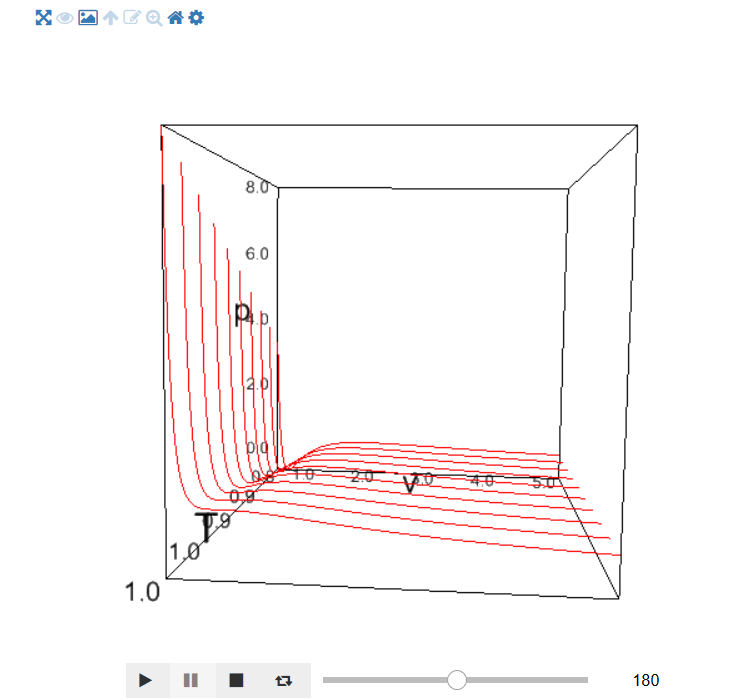
Interface
The main interface (main_block_116_000) contains the 3D ipyvolume figure fig3d and the play and degrees_slider widgets. Those widgets update the angle of the camera of the figure.
[1]:
from IPython.display import Image
Image(filename='../../static/images/apps/116-000_1.png')
[1]:
Packages
[2]:
import ipywidgets as widgets
import ipyvolume as ipv

import numpy as np
Physical functions
This are the functions that have a physical meaning:
get_relative_isotherms
[3]:
def get_relative_isotherms(v_range, T_range):
    """This function calculates the theoretical p(v, T) plane
        (in reduced coordinates) according to van der Waals
        equation of state from a given range of volumes
        and tenperatures.

    Args:
        v_range: An array containing the values of v
        (in reduced coordinates)for which the isotherms must be
        calculated.\n
        T_range: An array containing the values of T
        (in reduced coordinates)for which the isotherms must be
        calculated.\n


    Returns:
        isotherms: A list consisted of numpy arrays containing the
        pressures of each isotherm.
    """

    isotherms = []

    for T in T_range:
        p_R = []
        for v in v_range:
            val = (8.0/3.0*T/(v - 1.0/3.0) - 3.0/v**2)
            p_R = np.append(p_R, val)

        isotherms.append(p_R)

    return isotherms
Main interface
[ ]:
T_values = np.linspace(0.8, 1.0, 10)
v_values = np.linspace(0.45, 5.0, 500)

p_values = get_relative_isotherms(v_values, T_values)

fig3d = ipv.pylab.figure(
    key=None,
    width=600,
    height=500,
    lighting=True,
    controls=True,
    controls_vr=False,
    controls_light=False,
    debug=False
)

ipv.pylab.xlim(min(v_values), max(v_values))
ipv.pylab.ylim(0.0, 2.0)
ipv.pylab.zlim(min(T_values), max(T_values))

ipv.pylab.xlabel('v')
ipv.pylab.ylabel('p')
ipv.pylab.zlabel('T')

ipv.pylab.view(azimuth=180, elevation=None, distance=None)

for i in range(len(T_values)):

    x_values = np.asarray(v_values)
    y_values = np.asarray(p_values[i])
    z_values = np.asarray(
        [T_values[i] for elem in v_values]
    )

    ipv.pylab.plot(
        x_values,
        y_values,
        z_values
    )

degrees_slider = widgets.IntSlider(
    value=180,
    min=0,
    max=360,
    step=1,
    description='',
    disabled=False,
    continuous_update=True,
    orientation='horizontal',
    readout=True,
    readout_format='d'
)

degrees_slider.observe(update_camera_angle, 'value')

play = widgets.Play(
    value=180,
    min=0,
    max=360,
    step=1,
    description="Press play",
    disabled=False
)

widgets.jslink((play, 'value'), (degrees_slider, 'value'));

main_block_116_000 = widgets.VBox([
    fig3d,
    widgets.HBox([
        play,
        degrees_slider
    ])
    ],
    layout=widgets.Layout(
        align_items='center'
    )
)

main_block_116_000