Visualization of molar volume during a liquid-gas phase transition
Code: #112-000
File: apps/van_der_waals/phase_transition_volume.ipynb
Run it online: ![]()
The aim of this notebook is to visualize the change in molar volume during a first-orden liquid-gas transition.
Interface
The main interface (main_block_112_000) is divided in two HBox: top_block_112_000 and bottom_block_112_000. bottom_block_112_000 contains of 3 bqplot Figures: fig_112_001, fig_112_002 and fig_112_003.
[1]:
from IPython.display import Image
Image(filename='../../static/images/apps/112-000_1.png')
[1]:
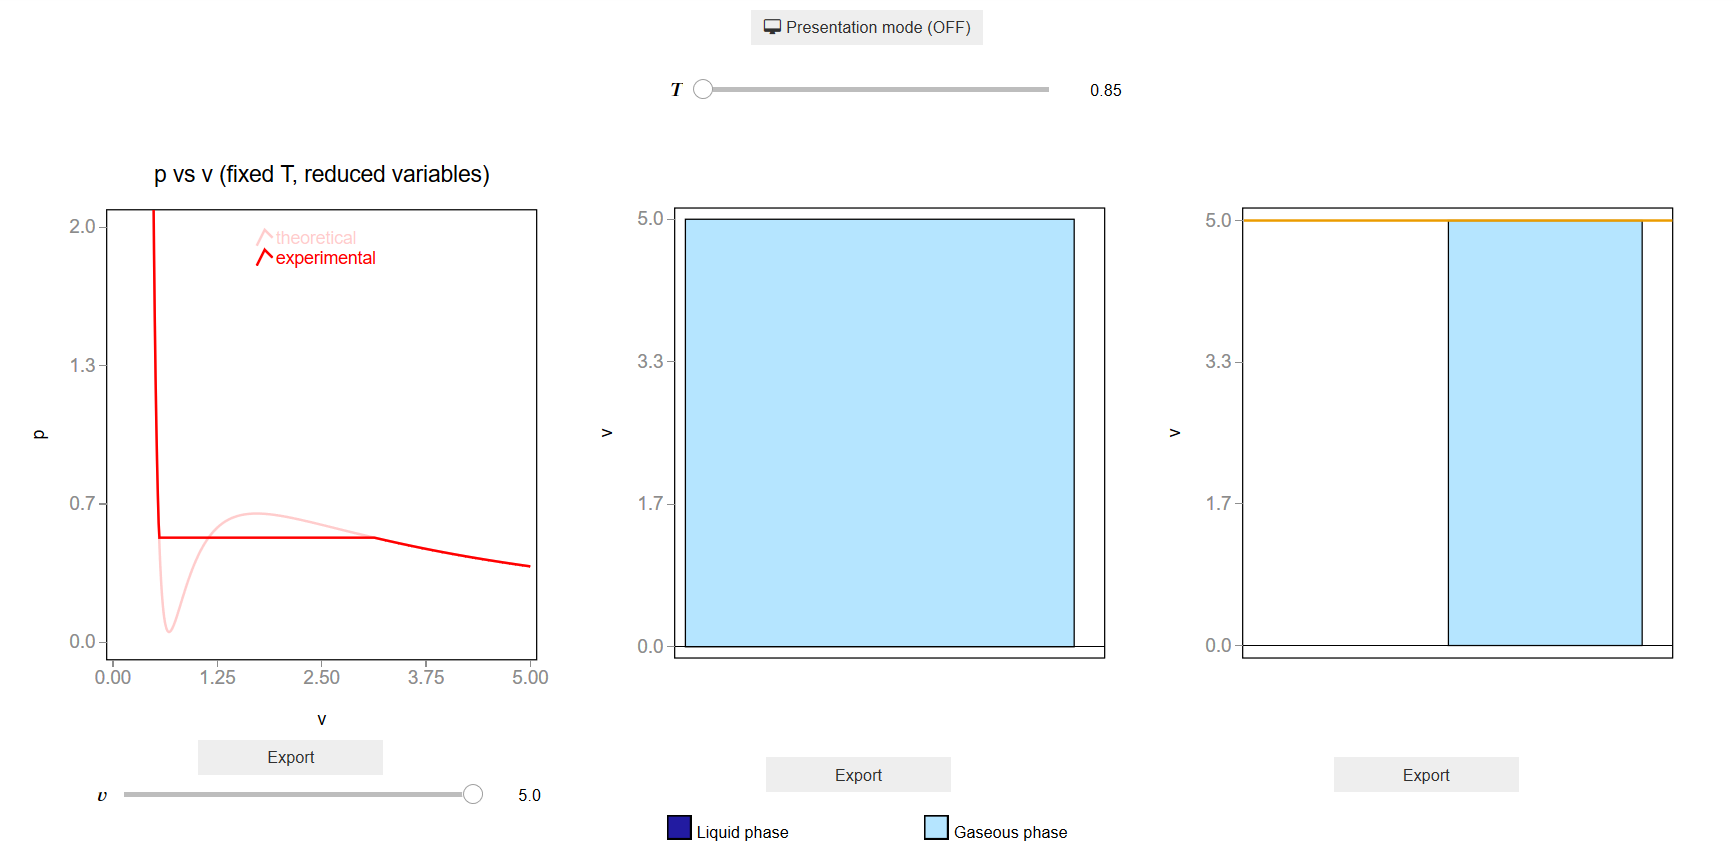
The slider T_slider updates the values of \(T\) which updates the bars and scatter points of fig_112_001, fig_112_002 and fig_112_003.
[2]:
Image(filename='../../static/images/apps/112-000_2.png')
[2]:
CSS
A custom css file is used to improve the interface of this application. It can be found here.
[3]:
from IPython.display import HTML
display(HTML("<head><link rel='stylesheet' type='text/css' href='./../../static/custom.css'></head>"))
display(HTML("<style>.container { width:100% !important; }</style>"))
Packages
[4]:
from bqplot import *
import bqplot as bq
import bqplot.marks as bqm
import bqplot.scales as bqs
import bqplot.axes as bqa

import ipywidgets as widgets

import numpy as np

import urllib.parse
import webbrowser

import sys
Physical functions
This are the functions that have a physical meaning:
get_relative_isothermsexperimetal_isothermsget_rootsp_indefinite_integralp_definite_integralfind_real_fixed_Tget_volumes_propotions
[5]:
def get_relative_isotherms(v_range, T_range):
    """This function calculates the theoretical p(v, T) plane
        (in reduced coordinates) according to Van der Waals
        equation of state from a given range of volumes
        and tenperatures.

    Args:
        v_range: An array containing the values of v
        (in reduced coordinates)for which the isotherms must be
        calculated.\n
        T_range: An array containing the values of v
        (in reduced coordinates)for which the isotherms must be
        calculated.\n


    Returns:
        isotherms: A list consisted consisted of numpy arrays containing the
        pressures of each isotherm.
    """

    isotherms = []

    for T in T_range:
        p_R = []
        for v in v_range:
            val = (8.0/3.0*T/(v - 1.0/3.0) - 3.0/v**2)
            p_R = np.append(p_R, val)

        isotherms.append(p_R)

    return isotherms
[6]:
def experimental_isotherms(p_range, v_range, T_range, fixed_p, fixed_T):
    """This function calculates the experimental p(v, T) plane
        (in reduced coordinates) according to van der Waals
        equation of state for a given range of volumes
        and tenperatures or for a given range of volumes
        and pressures.

    Args:
        p_range: An array containing the values of p
        (in reduced coordinates)for which the isotherms must be
        calculated. Only used if fixed_p == True.\n
        v_range: An array containing the values of v
        (in reduced coordinates)for which the isotherms must be
        calculated.\n
        T_range: An array containing the values of v
        (in reduced coordinates)for which the isotherms must be
        calculated. Only used if fixed_T == True.\n
        fixed_p: Boolean variable which represents if the isotherms
        must be calculated for a given pressures.\n
        fixed_T: Boolean variable which represents if the isotherms
        must be calculated for a given pressures.\n


    Returns:
        expe_data: A list consisted of numpy arrays containing the
        pressures of each theoretical isotherm.\n
        theo_data: A list consisted of numpy arrays containing the
        pressures of each theoretical isotherm.\n
        v_limits: A list consisted of arrays of the volume limits of
        the phase-transition of each subcritical isotherm.\n
        p_limits: A list consisted of arrays of the pressure limits of
        the phase-transition of each subcritical isotherm.\n
        tenperatures: A list consisted of the tenperatures of the
        isotherms.\n
    """

    if fixed_T:

        theo_data = get_relative_isotherms(v_range, T_range)
        expe_data = []

        v_limits = []
        p_limits = []

        p_range = np.linspace(0.001, 1.0, num=10000)
        pressures, v_isobaric_limits = find_real_fixed_T(p_range, T_range)

        for i in range(len(theo_data)):

            p_expe = []

            if i < len(v_isobaric_limits):

                    v_lim = v_isobaric_limits[i]

                    if len(v_lim) > 1: #check if there is only one point
                        for j in range(len(v_range)):

                            if v_range[j] > v_lim[0] and v_range[j] < v_lim[1]:
                                p_expe.append(pressures[i])

                            else:
                                p_expe.append(theo_data[i][j])

                        v_limits = np.append(v_limits, [v_lim[0], v_lim[1]])
                        p_limits = np.append(p_limits, [pressures[i], pressures[i]])

                    else:
                        p_expe = theo_data[i]
                        v_limits = np.append(v_limits, [1.0])
                        p_limits = np.append(p_limits, [1.0])

            else:

                p_expe = theo_data[i]

            expe_data.append(p_expe)

        tenperatures = T_range

        return expe_data, theo_data, p_limits, v_limits, tenperatures

    elif fixed_p:

        tenperatures, v_isobaric_limits = find_real_fixed_p(p_range, T_range)

        theo_data = get_relative_isotherms(v_range, tenperatures)
        expe_data = []

        v_limits = []
        p_limits = []

        for i in range(len(theo_data)):

            p_expe = []

            if i < len(v_isobaric_limits):

                    v_lim = v_isobaric_limits[i]

                    if len(v_lim) > 1: #check if there is only one point

                        for j in range(len(v_range)):

                            if v_range[j] > v_lim[0] and v_range[j] < v_lim[1]:
                                p_expe.append(p_range[i])

                            else:
                                p_expe.append(theo_data[i][j])

                        v_limits = np.append(v_limits, [v_lim[0], v_lim[1]])
                        p_limits = np.append(p_limits, [p_range[i], p_range[i]])

                    else:
                        p_expe = theo_data[i]
                        v_limits = np.append(v_limits, [1.0])
                        p_limits = np.append(p_limits, [1.0])

            else:

                p_expe = theo_data[i]

            expe_data.append(p_expe)

        return expe_data, theo_data, p_limits, v_limits, tenperatures
[7]:
def get_roots(p, T):
    """This function finds the intersection between an isobaric curve
       and Van der Waals equation of state for a given T.\n
       Values of v with no physical meaning are dismissed
       (v < 0 or complex).

    Args:
        p: Pressure of the isobaric curve.\n
        T: Tenperature of the isotherm.\n


    Returns:
        roots_in_range: A sorted list of the volumes in which the
        isobaric curve intersects the isotherm.\n
    """

    roots = np.roots([1.0, - 1.0/3.0*(1.0 + 8.0*T/p), 3.0/p, -1.0/p])
    roots_in_range = []

    for root in roots:

        # A third degree polynomial has 3 complex roots,
        # but we are only interested in the ones which are
        # purely real.

        if np.isreal(root):

            root = np.real(root)

            if root > 0:

                roots_in_range.append(root)

    roots_in_range.sort()

    return roots_in_range
[8]:
def p_indefinite_integral(p_0, v_0, T):
    """This function calculates the indefinite integral between
    a van der Waals isotherm and a isobaric line.

    Args:
        p0: Isobaric line's pressure.\n
        v0: Value of the volume.\n
        T: Value of the tenperature.\n

    Returns:
        integral: Value of the indefinite integral between a
        van der Waals isotherm at T and a isobaric line of p0 at a
        volume v0.\n
    """

    integral = 8.0/3.0 * T *np.log(v_0 - 1.0/3.0) + 3.0/v_0 - p_0*v_0

    return integral
[9]:
def definite_integral(p_0, v_range, T):
    """This function 'p_indefinite_integral' function to calculate
    the definite integral between a van der Waals isotherm and a
    isobaric line.

    Args:
        p0: Isobaric line's pressure.\n
        v_range: Tuple or list consisted of volume limits.\n
        T: Value of the tenperature.\n

    Returns:
        integral: Value of the definite integral between a
        van der Waals isotherm at T and a isobaric line of p0 in a
        volume range v_range.\n
    """

    v_0, v_1 = v_range[0], v_range[1]

    integral = p_indefinite_integral(p_0, v_1, T) - p_indefinite_integral(p_0, v_0, T)

    return integral
[10]:
def find_real_fixed_T(p_values, T_values):
    """This function uses Maxwell's construction to find the
       pressures in which phase transition happens given some
       fixed tenperatures.\n

    Args:
        p_values: List of pressures in which the real isotherm is
        searched.\n
        T_values: List of tenperatures of the isotherms.\n


    Returns:
        pressures: List of pressures in which phase transition
        happens.\n
        v_range: Volume limits of phase transition zones.
    """

    eps = 1e-3

    pressures = []
    v_ranges = []

    for T in T_values:

        if T < 1.0:

            for p in p_values:

                roots = get_roots(p, T)

                if len(roots) == 3:

                    v_range = [roots[0], roots[2]]
                    area = definite_integral(p, v_range, T)

                    if abs(area) < eps:

                        pressures.append(p)
                        v_ranges.append(v_range)

                        break

        elif T == 1.0:

            pressures.append(1.0)
            v_ranges.append([1.0])

    return pressures, v_ranges
[11]:
def get_volumes_propotions(v_limits, v):
    """This function calculates the propotion of gas/liquid
       during a phase transistion at a volume v.\n

    Args:
        v_limits: Volume limits in which the phase transition
        happens.\n
        v: value of the volume.\n


    Returns:
        x_g: propotion of the gas phase.\n
        x_l: propotion of the liquid phase.
    """

    v_l = v_limits[0]
    v_g = v_limits[1]

    x_l = (v_g - v)/(v_g - v_l)
    x_g = (v - v_l)/(v_g - v_l)

    return x_g, x_l
Main interface
[ ]:
"""This module visualizes the change in molar volumen of both phases
during a liquid-gas phase transition.

"""

v_values = np.linspace(0.4, 5.0, 500)
T_values = np.round(np.linspace(0.85, 1.2, 10), 2)

colors = ['#221ba1','#b5e5ff'] #light blue, dark_blue
gradient = generate_gradient(colors[0], colors[1], 500)

expe_data, theo_data, p_limits, v_limits, tenperatures = experimental_isotherms(
    [],
    v_values,
    T_values,
    fixed_p = False,
    fixed_T = True,
)

#######################
#######TOP BLOCK####
#######################

top_block = widgets.VBox([], layout=widgets.Layout(align_items='center', width='100%'))

change_view_button = widgets.ToggleButton(
    value=False,
    description='Presentation mode (OFF)',
    disabled=False,
    button_style='',
    tooltip='',
    icon='desktop',
    layout=widgets.Layout(
        width='auto'
    )
)

change_view_button.observe(change_view, 'value')

T_slider = widgets.SelectionSlider(
    options= T_values,
    value=T_values[0],
    description=r'\( T \)',
    disabled=False,
    continuous_update=True,
    orientation='horizontal',
    readout=True,
    layout = widgets.Layout(
        width = '33%',
        align_self='center',
        margin='20px 0 0 0'
    )
)

T_slider.observe(change_tenperature, 'value')

top_block.children = [
    change_view_button,
    T_slider
]

#######################
#######MIDDLE BLOCK####
#######################

middle_block = widgets.HBox([], layout=widgets.Layout(align_items='center', width='100%'))

scale_x = bqs.LinearScale(min = 0.0, max = max(v_values))
scale_y = bqs.LinearScale(min = 0, max = 2.0)

axis_x = bqa.Axis(
    scale=scale_x,
    tick_format='.2f',
    tick_style={'font-size': '15px'},
    tick_values = np.linspace(0, max(v_values), 5),
    grid_lines = 'none',
    grid_color = '#8e8e8e',
    label='v',
    label_location='middle',
    label_style={'stroke': 'black', 'default-size': 35},
    label_offset='50px'
)

axis_y = bqa.Axis(
    scale=scale_y,
    tick_format='.1f',
    tick_style={'font-size': '15px'},
    tick_values = np.linspace(0, 2.0, 4),
    grid_lines = 'none',
    grid_color = '#8e8e8e',
    orientation='vertical',
    label='p',
    label_location='middle',
    label_style={'stroke': 'red', 'default_size': 35},
    label_offset='50px'
)

fig_112_001 = bq.Figure(
    title='p vs v (fixed T, reduced variables)',
    marks=[],
    axes=[axis_x, axis_y],
    animation_duration=0, #500,
    legend_location='top-right',
    legend_text =  {'font-size': '14px'},
    background_style= {'fill': 'white',  'stroke': 'black'},
    fig_margin=dict(top=80, bottom=60, left=80, right=30),
    toolbar = True,
    layout = widgets.Layout(width='100%', height='500px'),
)

lines_112_001 = bqm.Lines(
    x = v_values,
    y = [theo_data[T_slider.index], expe_data[T_slider.index]],
    scales = {'x': scale_x, 'y': scale_y},
    opacities = [0.2, 1.0],
    visible = True,
    colors = ['red'],
    labels = ['theoretical', 'experimental'],
    display_legend = True
)

tracer_112_001 = bqm.Scatter(
    name = '',
    x = [0.0],
    y = [0.0],
    scales = {'x': scale_x, 'y': scale_y},
    opacity = [1.0, 0.0],
    visible = False,
    colors = ['#2807a3'],
)

fig_112_001.marks = [lines_112_001, tracer_112_001]

v_values_rounded = np.round(v_values, 3)

v_slider = widgets.SelectionSlider(
    options=v_values_rounded,
    value=v_values_rounded[-1],
    description=r'\( v \)',
    disabled=False,
    continuous_update=True,
    orientation='horizontal',
    readout=True,
    layout = widgets.Layout(width = '100%', margin='0 50px 0 50px')
)

v_slider.observe(update_tracer, 'value')


new_x_scale = bqs.LinearScale(min=0.5, max=1.5)

bar_112_002 = bqm.Bars(
    x=[1.0],
    y=[max(v_values)],
    scales={'x': bqs.OrdinalScale(), 'y': scale_x},
    colors=['#b5e5ff', '#221ba1'],
)

original_112_002 = bqm.Bars(
    x=[1.0],
    y=[max(v_values)],
    scales={'x': bqs.OrdinalScale(), 'y': scale_x},
    colors=['#d9d9d9'],
    opacities = [0.2]
)

axis_x_002 = bqa.Axis(
    scale=new_x_scale,
    tick_format='.2f',
    tick_style={'font-size': '15px'},
    num_ticks=0,
    grid_lines = 'none',
    grid_color = '#8e8e8e',
    label='',
    label_location='middle',
    label_style={'stroke': 'black', 'default-size': 35},
    label_offset='50px'
)

axis_y_002 = bqa.Axis(
    scale=scale_x,
    tick_format='.1f',
    tick_style={'font-size': '15px'},
    tick_values = np.linspace(0, max(v_values), 4),
    grid_lines = 'none',
    grid_color = '#8e8e8e',
    orientation='vertical',
    label='v',
    label_location='middle',
    label_style={'stroke': 'red', 'default_size': 35},
    label_offset='50px'
)

fig_112_002 = bq.Figure(
    title='',
    marks=[],
    axes=[axis_x_002, axis_y_002],
    animation_duration=0,
    legend_location='top-right',
    background_style= {'fill': 'white',  'stroke': 'black'},
    fig_margin=dict(top=65, bottom=75, left=80, right=30),
    toolbar = True,
    layout = widgets.Layout(width='100%', height='500px')
)

fig_112_002.marks = [original_112_002, bar_112_002, ]

bar_112_003 = bqm.Bars(
    x=[[1.0],[1.0]],
    y=[[0.0], [max(v_values)]],
    scales={'x': bqs.OrdinalScale(), 'y': scale_x},
    colors=['#221ba1', '#b5e5ff'],
    type='grouped'
)

lines_112_003 = bqm.Lines(
    x = [0.0, 5.0],
    y = [max(v_values), max(v_values)],
    scales = {
        'x': bqs.LinearScale(min=0, max=1.0),
        'y': scale_x
    },
    visible = True,
    colors = ['#eb9c00'],
)

axis_x_003 = bqa.Axis(
    scale=new_x_scale,
    tick_format='.2f',
    tick_style={'font-size': '15px'},
    num_ticks=0,
    grid_lines = 'none',
    grid_color = '#8e8e8e',
    label='',
    label_location='middle',
    label_style={'stroke': 'black', 'default-size': 35},
    label_offset='50px'
)

axis_y_003 = bqa.Axis(
    scale=scale_x,
    tick_format='.1f',
    tick_style={'font-size': '15px'},
    tick_values = np.linspace(0, max(v_values), 4),
    grid_lines = 'none',
    grid_color = '#8e8e8e',
    orientation='vertical',
    label='v',
    label_location='middle',
    label_style={'stroke': 'red', 'default_size': 35},
    label_offset='50px'
)

fig_112_003 = bq.Figure(title='',
    marks=[],
    axes=[axis_x_003, axis_y_003],
    animation_duration=0,
    legend_location='top-right',
    background_style= {'fill': 'white',  'stroke': 'black'},
    fig_margin=dict(top=65, bottom=75, left=80, right=30),
    toolbar = True,
    layout = widgets.Layout(width='100%', height='500px')
)

fig_112_003.marks = [bar_112_003, lines_112_003]

prepare_export_fig_112_001_button = widgets.Button(
    description='Export',
    disabled=False,
    button_style='',
    tooltip='',
)

prepare_export_fig_112_001_button.on_click(prepare_export)

prepare_export_fig_112_002_button = widgets.Button(
    description='Export',
    disabled=False,
    button_style='',
    tooltip='',
)

prepare_export_fig_112_002_button.on_click(prepare_export)

prepare_export_fig_112_003_button = widgets.Button(
    description='Export',
    disabled=False,
    button_style='',
    tooltip='',
)

prepare_export_fig_112_003_button.on_click(prepare_export)

export_button = widgets.HTML(
    value = ""
)

middle_block.children = [
    widgets.VBox([
         fig_112_001,
         prepare_export_fig_112_001_button,
         v_slider
    ],
        layout = widgets.Layout(
            align_items='center',
            width='33%'
        )
    ),
    widgets.VBox([
        fig_112_002,
        prepare_export_fig_112_002_button,
    ],
        layout = widgets.Layout(
            align_items='center',
            width='33%'
        )
    ),
    widgets.VBox([
        fig_112_003,
        prepare_export_fig_112_003_button
    ],
        layout = widgets.Layout(
            align_items='center',
            width='33%'
        )
    ),
]

#######################
#######BOTTOM BLOCK######
#######################

bottom_block_112_000 = widgets.VBox([
    widgets.HBox([
        widgets.HTML(
            '<svg width="20" height="20">' \
            '<rect width="20" height="20"' \
            'style="fill:#221ba1;stroke-width:3;' \
            'stroke:rgb(0,0,0)"/></svg>' \
        ),
        widgets.Label("Liquid phase",),
        widgets.HTML('<span style="display:inline-block; width: 100px;"></span>'),
        widgets.HTML(
                '<svg width="20" height="20">' \
                '<rect width="20" height="20"' \
                'style="fill:#b5e5ff;stroke-width:3;' \
                'stroke:rgb(0,0,0)"/></svg>' \
            ),
        widgets.Label("Gaseous phase"),
    ])],
    layout=widgets.Layout(
        align_items='center',
        width='100%'
    )
)


#######################
#######MAIN BLOCK######
#######################

main_block_112_000 = widgets.VBox(
    [],
    layout=widgets.Layout(
        align_items='center',
        width='100%'
    )
)

main_block_112_000.children = [
    top_block,
    middle_block,
    bottom_block_112_000
]


figures = [
    fig_112_001,
    fig_112_002,
    fig_112_003
]

main_block_112_000