Chemical potential of a van der Waals real gas
Code: #117-000
File: apps/van_der_waals/chemical_potential.ipynb
Run it online: ![]()
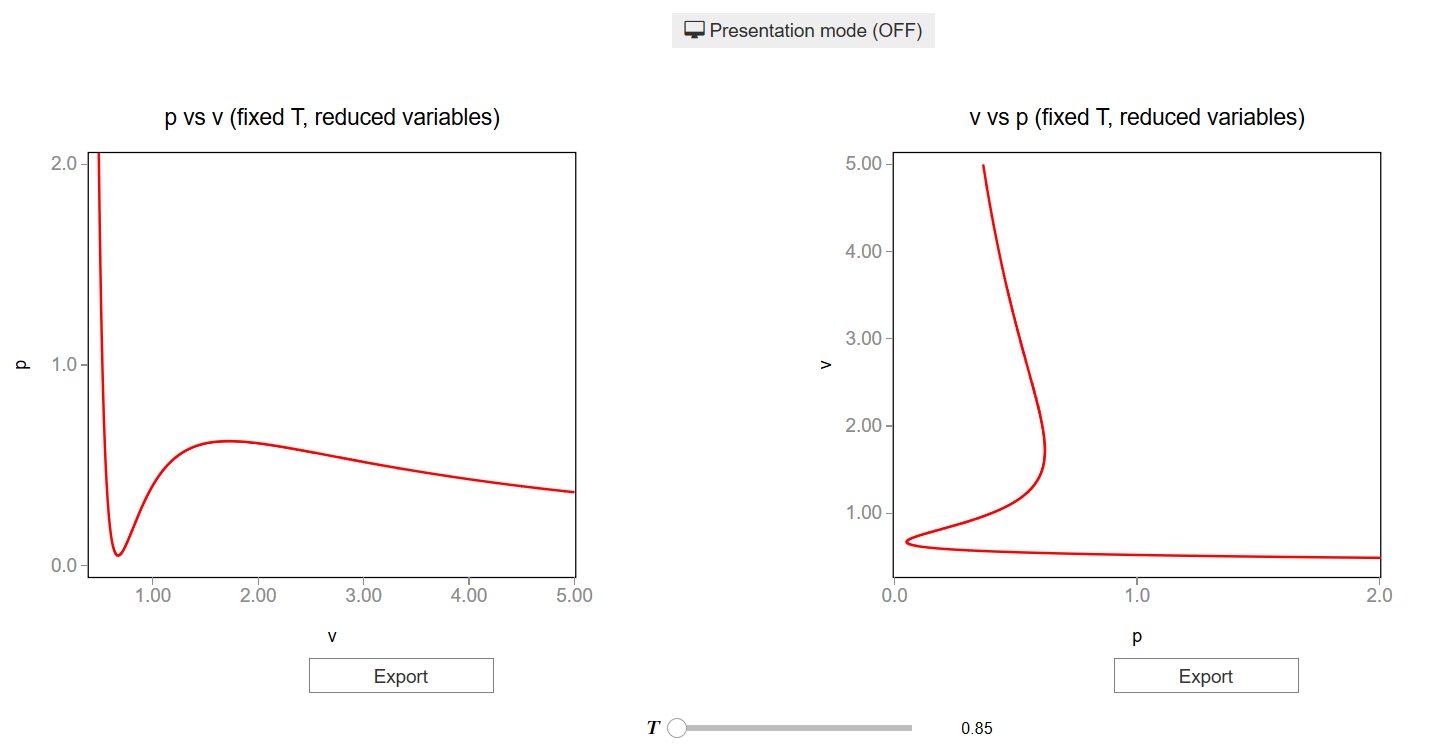
The aim of this notebook is to show the contruction of the chemical potential based in van der Waals’ isotherms.
Interface
The main interface (main_block_117_000) is divided in five VBox: block_1, block_2, block_3, block_4 and block_5. block_1 contains two bqplot Figures: fig_117_001 and fig_117_002. block_2 contains the T_slider widget which controls the isotherms and chemical potentials shown in fig_117_001, fig_117_002, fig_117_003 and fig_117_004. block_3 contains two bqplot Figures: fig_117_003 and fig_117_004. block_4 contains two
bqplot Figures: fig_117_005 and fig_117_006. block_5 contains two bqplot Figures: fig_117_007 and fig_117_008.
[1]:
from IPython.display import Image
Image(filename='../../static/images/apps/117-000_1.png')
[1]:
[2]:
Image(filename='../../static/images/apps/117-000_2.png')
[2]:
[3]:
Image(filename='../../static/images/apps/117-000_3.png')
[3]:
[4]:
Image(filename='../../static/images/apps/117-000_4.png')
[4]:
CSS
A custom css file is used to improve the interface of this application. It can be found here.
[5]:
from IPython.display import HTML
display(HTML("<head><link rel='stylesheet' type='text/css' href='./../../static/custom.css'></head>"))
display(HTML("<style>.container { width:100% !important; }</style>"))
display(HTML("<style>.widget-label { display: contents !important; }</style>"))
display(HTML("<style>.slider-container { margin: 12px !important; }</style>"))
display(HTML("<style>.jupyter-widgets { overflow: auto !important; }</style>"))
Packages
[6]:
from bqplot import *
import bqplot as bq
import bqplot.marks as bqm
import bqplot.scales as bqs
import bqplot.axes as bqa

import ipywidgets as widgets

import urllib.parse
import webbrowser

import sys
Physical functions
This are the functions that have a physical meaning:
get_relative_isothermsexperimetal_isothermsget_rootsp_indefinite_integralp_definite_integralfind_real_fixed_pfind_real_fixed_Tget_chemical_potential
[7]:
def get_relative_isotherms(v_range, T_range):
    """This function calculates the theoretical p(v, T) plane
        (in reduced coordinates) according to van der Waals
        equation of state from a given range of volumes
        and tenperatures.

    Args:
        v_range: An array containing the values of v
        (in reduced coordinates)for which the isotherms must be
        calculated.\n
        T_range: An array containing the values of v
        (in reduced coordinates)for which the isotherms must be
        calculated.\n


    Returns:
        isotherms: A list consisted of numpy arrays containing the
        pressures of each isotherm.
    """

    isotherms = []

    for T in T_range:
        p_R = []
        for v in v_range:
            val = (8.0/3.0*T/(v - 1.0/3.0) - 3.0/v**2)
            p_R = np.append(p_R, val)

        isotherms.append(p_R)

    return isotherms

    return isotherms
[8]:
def experimental_isotherms(p_range, v_range, T_range, fixed_p, fixed_T):
    """This function calculates the experimental p(v, T) plane
        (in reduced coordinates) according to van der Waals
        equation of state for a given range of volumes
        and tenperatures or for a given range of volumes
        and pressures.

    Args:
        p_range: An array containing the values of p
        (in reduced coordinates)for which the isotherms must be
        calculated. Only used if fixed_p == True.\n
        v_range: An array containing the values of v
        (in reduced coordinates)for which the isotherms must be
        calculated.\n
        T_range: An array containing the values of v
        (in reduced coordinates)for which the isotherms must be
        calculated. Only used if fixed_T == True.\n
        fixed_p: Boolean variable which represents if the isotherms
        must be calculated for a given pressures.\n
        fixed_T: Boolean variable which represents if the isotherms
        must be calculated for a given pressures.\n


    Returns:
        expe_data: A list consisted of numpy arrays containing the
        pressures of each theoretical isotherm.\n
        theo_data: A list consisted of numpy arrays containing the
        pressures of each theoretical isotherm.\n
        v_limits: A list consisted of arrays of the volume limits of
        the phase-transition of each subcritical isotherm.\n
        p_limits: A list consisted of arrays of the pressure limits of
        the phase-transition of each subcritical isotherm.\n
        tenperatures: A list consisted of the tenperatures of the
        isotherms.\n
    """

    if fixed_T:

        theo_data = get_relative_isotherms(v_range, T_range)
        expe_data = []

        v_limits = []
        p_limits = []

        p_range = np.linspace(0.001, 1.0, num=10000)
        pressures, v_isobaric_limits = find_real_fixed_T(p_range, T_range)

        for i in range(len(theo_data)):

            p_expe = []

            if i < len(v_isobaric_limits):

                    v_lim = v_isobaric_limits[i]

                    if len(v_lim) > 1: #check if there is only one point
                        for j in range(len(v_range)):

                            if v_range[j] > v_lim[0] and v_range[j] < v_lim[1]:
                                p_expe.append(pressures[i])

                            else:
                                p_expe.append(theo_data[i][j])

                        v_limits = np.append(v_limits, [v_lim[0], v_lim[1]])
                        p_limits = np.append(p_limits, [pressures[i], pressures[i]])

                    else:
                        p_expe = theo_data[i]
                        v_limits = np.append(v_limits, [1.0])
                        p_limits = np.append(p_limits, [1.0])

            else:

                p_expe = theo_data[i]

            expe_data.append(p_expe)

        tenperatures = T_range

        return expe_data, theo_data, p_limits, v_limits, tenperatures

    elif fixed_p:

        tenperatures, v_isobaric_limits = find_real_fixed_p(p_range, T_range)

        theo_data = get_relative_isotherms(v_range, tenperatures)
        expe_data = []

        v_limits = []
        p_limits = []

        for i in range(len(theo_data)):

            p_expe = []

            if i < len(v_isobaric_limits):

                    v_lim = v_isobaric_limits[i]

                    if len(v_lim) > 1: #check if there is only one point

                        for j in range(len(v_range)):

                            if v_range[j] > v_lim[0] and v_range[j] < v_lim[1]:
                                p_expe.append(p_range[i])

                            else:
                                p_expe.append(theo_data[i][j])

                        v_limits = np.append(v_limits, [v_lim[0], v_lim[1]])
                        p_limits = np.append(p_limits, [p_range[i], p_range[i]])

                    else:
                        p_expe = theo_data[i]
                        v_limits = np.append(v_limits, [1.0])
                        p_limits = np.append(p_limits, [1.0])

            else:

                p_expe = theo_data[i]

            expe_data.append(p_expe)

        return expe_data, theo_data, p_limits, v_limits, tenperatures
[9]:
def get_roots(p, T):
    """This function finds the intersection between an isobaric curve
       and Van der Waals equation of state for a given T.\n
       Values of v with no physical meaning are dismissed
       (v < 0 or complex).

    Args:
        p: Pressure of the isobaric curve.\n
        T: Tenperature of the isotherm.\n


    Returns:
        roots_in_range: A sorted list of the volumes in which the
        isobaric curve intersects the isotherm.\n
    """

    roots = np.roots([1.0, - 1.0/3.0*(1.0 + 8.0*T/p), 3.0/p, -1.0/p])
    roots_in_range = []

    for root in roots:

        # A third degree polynomial has 3 complex roots,
        # but we are only interested in the ones which are
        # purely real.

        if np.isreal(root):

            root = np.real(root)

            if root > 0:

                roots_in_range.append(root)

    roots_in_range.sort()

    return roots_in_range
[10]:
def p_indefinite_integral(p_0, v_0, T):
    """This function calculates the indefinite integral between
    a van der Waals isotherm and a isobaric line.

    Args:
        p0: Isobaric line's pressure.\n
        v0: Value of the volume.\n
        T: Value of the tenperature.\n

    Returns:
        integral: Value of the indefinite integral between a
        van der Waals isotherm at T and a isobaric line of p0 at a
        volume v0.\n
    """

    integral = 8.0/3.0 * T *np.log(v_0 - 1.0/3.0) + 3.0/v_0 - p_0*v_0

    return integral
[11]:
def definite_integral(p_0, v_range, T):
    """This function 'p_indefinite_integral' function to calculate
    the definite integral between a van der Waals isotherm and a
    isobaric line.

    Args:
        p0: Isobaric line's pressure.\n
        v_range: Tuple or list consisted of volume limits.\n
        T: Value of the tenperature.\n

    Returns:
        integral: Value of the definite integral between a
        van der Waals isotherm at T and a isobaric line of p0 in a
        volume range v_range.\n
    """

    v_0, v_1 = v_range[0], v_range[1]

    integral = p_indefinite_integral(p_0, v_1, T) - p_indefinite_integral(p_0, v_0, T)

    return integral
[12]:
def find_real_fixed_T(p_values, T_values):
    """This function uses Maxwell's construction to find the
       pressures in which phase transition happens given some
       fixed tenperatures.\n

    Args:
        p_values: List of pressures in which the real isotherm is
        searched.\n
        T_values: List of tenperatures of the isotherms.\n


    Returns:
        pressures: List of pressures in which phase transition
        happens.\n
        v_range: Volume limits of phase transition zones.
    """

    eps = 1e-3

    pressures = []
    v_ranges = []

    for T in T_values:

        if T < 1.0:

            for p in p_values:

                roots = get_roots(p, T)

                if len(roots) == 3:

                    v_range = [roots[0], roots[2]]
                    area = definite_integral(p, v_range, T)

                    if abs(area) < eps:

                        pressures.append(p)
                        v_ranges.append(v_range)

                        break

        elif T == 1.0:

            pressures.append(1.0)
            v_ranges.append([1.0])

    return pressures, v_ranges
[13]:
def get_chemical_potential(p_values, v_values):
    """This function calculates chemical potential by integrating
    v(p) isotherms.\n

    Args:
        p_values: List of numpy arrays containing the pressures of
        the isotherms.\n
        v_values: List of numpy arrays containing the volumes of
        the isotherms.\n


    Returns:
        mu: List of numpy arrays containing the chemical potentials of
        the isotherms.
    """

    mu = []


    for i in range(len(v_values)):

        v = v_values[i]
        p = p_values[i]

        pot = [10.0] #starting random value

        l = np.size(p)

        for j in range(1, l):
            pot.append(pot[j-1] + v[j]*(p[j] - p[j-1]))

        mu.append(pot)

    return mu
Main interface
[31]:
#v_values_1 = np.geomspace(0.48, 0.8, 1000)
#v_values_2 = np.geomspace(0.8, 5.2, 500)
#
#v_values = np.concatenate((v_values_1, v_values_2))
v_values = np.geomspace(0.48, 5.0, 1000)
T_values = np.round(np.linspace(0.85, 1.1, 15), 2)

if 1.0 not in T_values:
    T_values = np.sort(np.append(T_values, 1.0))

data = experimental_isotherms(
        p_range=[],
        v_range=v_values,
        T_range=T_values,
        fixed_T = True,
        fixed_p = False
)

expe_p_values = data[0]
theo_p_values = data[1]

p_limits = data[2]
v_limits = data[3]
T_limits = data[4]

colors = generate_gradient('#FF0000', '#FFfa00', len(T_limits))
opacities = [0.0 for t in T_values]
opacities[0] = 1.0

# change view button

change_view_button = widgets.ToggleButton(
    value=False,
    description='Presentation mode (OFF)',
    disabled=False,
    button_style='',
    tooltip='',
    icon='desktop',
    layout=widgets.Layout(
        width='auto'
    )
)

change_view_button.observe(change_view, 'value')
[32]:
################################
######1ST BLOCK#################
################################

# This block shows the p(v,T) (fig_117_001) and
# v(p,T) (fig_117_002) figures.


block_1 = widgets.VBox(
    [],
    layout=widgets.Layout(
        align_items='center',
        align_self= 'center'
    )
)

scale_x = bqs.LinearScale(min = 0.4, max = 5.0)
scale_y = bqs.LinearScale(min = 0.0, max = 2.0)

axis_x_001 = bqa.Axis(
    scale=scale_x,
    tick_format='.2f',
    tick_style={'font-size': '15px'},
    tick_values = [1.0, 2.0, 3.0, 4.0, 5.0],
    grid_lines = 'none',
    grid_color = '#8e8e8e',
    label='v',
    label_location='middle',
    label_style={'stroke': 'black', 'default-size': 35},
    label_offset='50px'
)

axis_y_001 = bqa.Axis(
    scale=scale_y,
    tick_format='.1f',
    tick_style={'font-size': '15px'},
    tick_values = [0, 1.0, 2.0],
    grid_lines = 'none',
    grid_color = '#8e8e8e',
    orientation='vertical',
    label='p',
    label_location='middle',
    label_style={'stroke': 'red', 'default_size': 35},
    label_offset='50px'
)

fig_117_001 = Figure(
    title='p vs v (fixed T, reduced variables)',
    marks=[],
    axes=[axis_x_001, axis_y_001],
    animation_duration=250,
    legend_location='top-right',
    background_style= {'fill': 'white',  'stroke': 'black'},
    min_aspect_ratio=1.0,
    max_aspect_ratio=1.0,
    fig_margin=dict(top=80, bottom=60, left=70, right=20),
    toolbar = True
)

lines_117_001 = bqm.Lines(
    x = v_values,
    y = np.array(theo_p_values),
    scales = {'x': scale_x, 'y': scale_y},
    opacities = opacities,
    visible = True,
    colors = colors,
)

fig_117_001.marks = [lines_117_001]

axis_x_002 = bqa.Axis(
    scale=scale_y,
    tick_format='.1f',
    tick_style={'font-size': '15px'},
    tick_values = [0, 1.0, 2.0],
    grid_lines = 'none',
    grid_color = '#8e8e8e',
    label='p',
    label_location='middle',
    label_style={'stroke': 'black', 'default-size': 35},
    label_offset='50px'
)

axis_y_002 = bqa.Axis(
    scale=scale_x,
    tick_format='.2f',
    tick_style={'font-size': '15px'},
    tick_values = [1.0, 2.0, 3.0, 4.0, 5.0],
    grid_lines = 'none',
    grid_color = '#8e8e8e',
    orientation='vertical',
    label='v',
    label_location='middle',
    label_style={'stroke': 'red', 'default_size': 35},
    label_offset='50px'
)

fig_117_002 = Figure(
    title='v vs p (fixed T, reduced variables)',
    marks=[],
    axes=[axis_x_002, axis_y_002],
    animation_duration=250,
    legend_location='top-right',
    background_style= {'fill': 'white',  'stroke': 'black'},
    min_aspect_ratio=1.0,
    max_aspect_ratio=1.0,
    fig_margin=dict(top=80, bottom=60, left=70, right=20),
    toolbar = True,
)

lines_117_002 = bqm.Lines(
    x = np.array(theo_p_values),
    y = np.array([v_values for p in theo_p_values]),
    scales = {'x': scale_y, 'y': scale_x},
    opacities = opacities,
    visible = True,
    colors = colors
)

fig_117_002.marks = [lines_117_002]

# Export buttons

prepare_export_fig_117_001_button = widgets.Button(
    description='Export',
    disabled=False,
    button_style='',
    tooltip='',
)

prepare_export_fig_117_001_button.on_click(prepare_export)

prepare_export_fig_117_002_button = widgets.Button(
    description='Export',
    disabled=False,
    button_style='',
    tooltip='',
)

prepare_export_fig_117_002_button.on_click(prepare_export)


block_1.children = [
    widgets.HBox([
        widgets.VBox([
            fig_117_001,
            prepare_export_fig_117_001_button
        ],
        layout=widgets.Layout(
            align_items='center'
        )),
        widgets.VBox([
            fig_117_002,
            prepare_export_fig_117_002_button
        ],
        layout=widgets.Layout(
            align_items='center'
        )),
    ],
        layout=widgets.Layout(
            width='100%',
            align_items='center'
        )
    )
]
[33]:
################################
######2ND BLOCK#################
################################

# This block shows the slider to control the tenperature
# (T_slider).

block_2 = widgets.VBox(
    [],
    layout=widgets.Layout(align_items='center')
)

T_slider = widgets.SelectionSlider(
    options= T_values,
    value=T_values[0],
    description=r'\( T \)',
    disabled=False,
    continuous_update=True,
    orientation='horizontal',
    readout=True,
    layout = widgets.Layout(
        width = '300px',
        height = 'auto',
        margin='0 0 0 50px'
    )
)

T_slider.observe(change_tenperature, 'value')

block_2.children = [T_slider]
[34]:
################################
######3RD BLOCK#################
################################
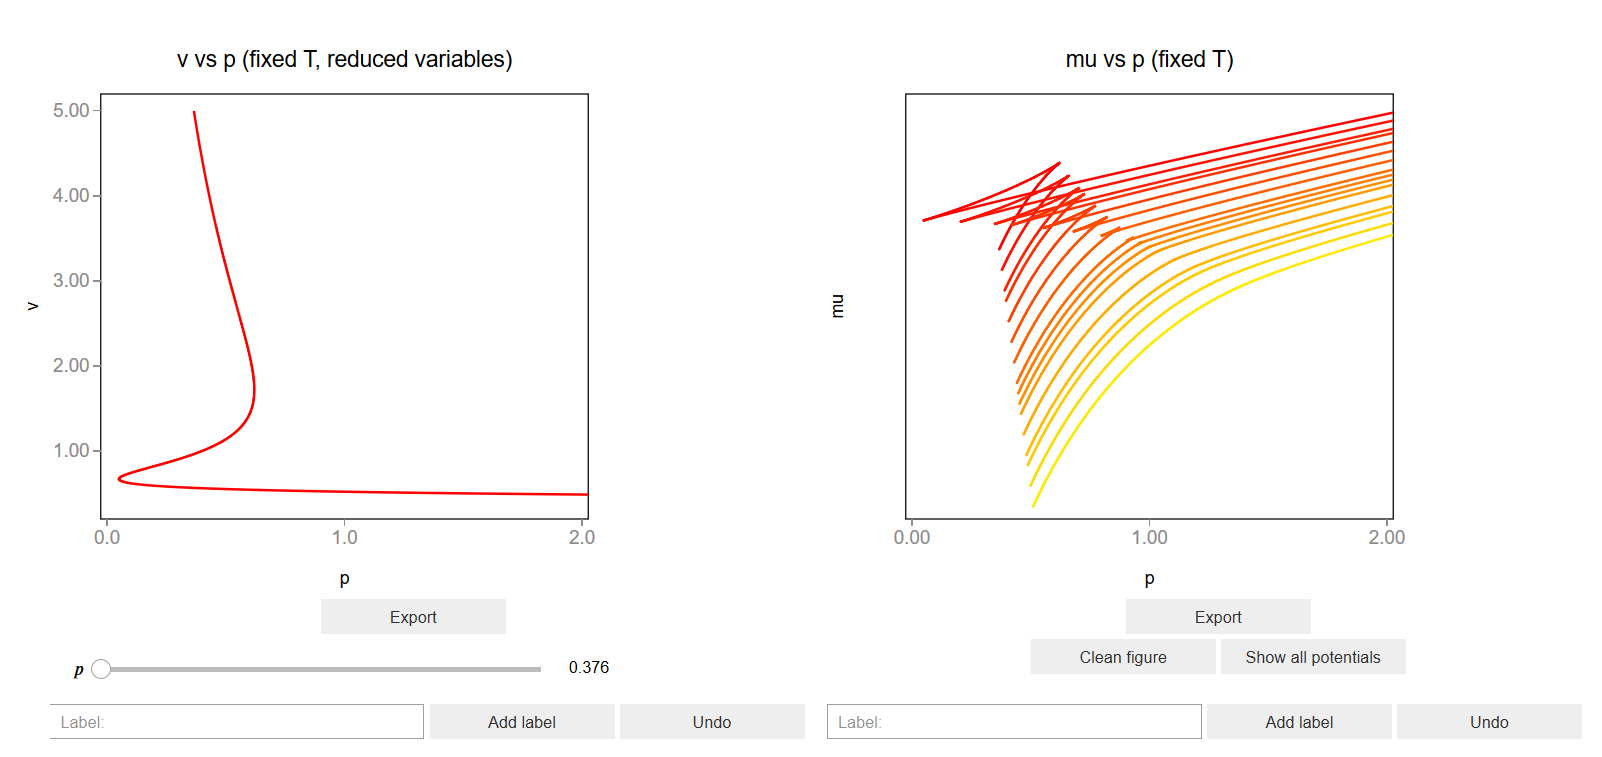
# This block shows the v(p,T) (fig_117_003) and
# mu(p,T) (fig_117_004) figures.
fig_117_003 = Figure(
title='v vs p (fixed T, reduced variables)',
marks=[],
axes=[axis_x_002, axis_y_002],
animation_duration=0, #500,
legend_location='top-right',
background_style= {'fill': 'white', 'stroke': 'black'},
min_aspect_ratio=1.0,
max_aspect_ratio=1.0,
fig_margin=dict(top=80, bottom=60, left=70, right=20),
toolbar = True,
)
area_117_003 = bqm.Lines(
x = [],
y = [],
scales = {'x': scale_y, 'y': scale_x},
opacities = [1.0],
visible = True,
colors = ['#39362d'],
fill = 'bottom',
fill_colors = ['#ffd429'],
fill_opacities = [0.4]
)
tracer_117_003 = bqm.Scatter(
name = '',
x = [0.0],
y = [0.0],
scales = {'x': scale_y, 'y': scale_x},
opacity = [1.0, 0.0],
visible = False,
colors = ['#2807a3'],
)
tt_003 = bq.Tooltip(
fields = ['x', 'y'],
formats = ['.3f', '.3f'],
labels = ['v', 'p']
)
labels_117_003 = bqm.Scatter(
name = 'labels',
x = [],
y = [],
scales = {'x': scale_y, 'y': scale_x},
#opacities = [1.0],
visible = True,
colors = ['black'],
names = [],
labels=['labels'],
tooltip = tt_003,
)
fig_117_003.marks = [
lines_117_002,
area_117_003,
tracer_117_003,
labels_117_003
]
theo_p_values_inverted = []
theo_v_values_inverted = []
for p_values in theo_p_values:
indexes = np.where(p_values < 2.2)
theo_p_values_inverted.append(
np.flip(np.take(p_values, indexes[0]))
)
theo_v_values_inverted.append(
np.flip(np.take(v_values, indexes[0]))
)
mu = get_chemical_potential(
theo_p_values_inverted,
theo_v_values_inverted
)
for i in range(len(mu)):
mu[i] = np.array(mu[i]) - 10.0*T_slider.options[i]
p_text = widgets.HTML(
value='<p> {:.3f} </p>'.format(theo_p_values_inverted[T_slider.index][i]),
layout = widgets.Layout(height='auto', margin='10px 0 0 10px')
)
p_slider = widgets.SelectionSlider(
options= theo_v_values_inverted[0],
value=theo_v_values_inverted[0][0],
description=r'\( p \)',
disabled=False,
continuous_update=True,
orientation='horizontal',
readout=False,
layout = widgets.Layout(
width = '60%',
height = 'auto',
margin='0 0 0 50px'
)
)
p_slider.observe(update_tracer, 'value')
p_slider.observe(update_text, 'value')
# Figure fig_117_004
scale_x_004 = bqs.LinearScale(min = 0.0, max = 2.0)
scale_y_004 = bqs.LinearScale(
min = min(mu[T_slider.index]),
max = max(mu[T_slider.index])
)
axis_x_004 = bqa.Axis(
scale=scale_x_004,
tick_format='.2f',
tick_style={'font-size': '15px'},
tick_values = [0.0, 1.0, 2.0],
grid_lines = 'none',
grid_color = '#8e8e8e',
label='p',
label_location='middle',
label_style={'stroke': 'black', 'default-size': 35},
label_offset='50px'
)
axis_y_004 = bqa.Axis(
scale=scale_y_004,
tick_format='.2f',
tick_style={'font-size': '15px'},
num_ticks = 0,
grid_lines = 'none',
grid_color = '#8e8e8e',
orientation='vertical',
label='mu',
label_location='middle',
label_style={'stroke': 'red', 'default_size': 35},
label_offset='50px'
)
fig_117_004 = Figure(
title='mu vs p (fixed T)',
marks=[],
axes=[axis_x_004, axis_y_004],
animation_duration=0,
legend_location='top-right',
background_style= {'fill': 'white', 'stroke': 'black'},
min_aspect_ratio=1.0,
max_aspect_ratio=1.0,
fig_margin=dict(top=80, bottom=60, left=70, right=20),
toolbar = True,
)
lines_117_004 = bqm.Lines(
x = [],
y = [],
scales = {'x': scale_x_004, 'y': scale_y_004},
opacities = [1.0],
visible = True,
colors = colors,
)
tracer_117_004 = bqm.Scatter(
name = '',
x = [0.0],
y = [0.0],
scales = {'x': scale_x_004, 'y': scale_y_004},
opacity = [1.0, 0.0],
visible = True,
colors = ['#2807a3'],
)
labels_117_004 = bqm.Scatter(
name = 'labels',
x = [],
y = [],
scales = {'x': scale_x_004, 'y': scale_y_004},
#opacities = [1.0],
visible = True,
colors = ['black'],
names = [],
labels=['labels'],
)
fig_117_004.marks = [
lines_117_004,
tracer_117_004,
labels_117_004,
]
restart_button = widgets.Button(
description='Clean figure',
disabled=False,
button_style='',
tooltip="",
layout = widgets.Layout(height='auto')
)
restart_button.on_click(restart_chemical_potential)
show_all_button = widgets.Button(
description='Show all potentials',
disabled=False,
button_style='',
tooltip="",
layout = widgets.Layout(height='auto')
)
show_all_button.on_click(show_all_potentials)
# Label buttons
label_input_117_003 = widgets.Text(
value='',
placeholder="Label:",
disabled = False,
)
add_label_button_117_003 = widgets.Button(
description='Add label',
disabled=False,
button_style='',
tooltip="Add label in tracer's position",
)
add_label_button_117_003.on_click(add_label_button_clicked)
undo_label_button_117_003 = widgets.Button(
description='Undo',
disabled=False,
button_style='',
tooltip="Remove last added label",
)
undo_label_button_117_003.on_click(undo_label_button_clicked)
label_input_117_004 = widgets.Text(
value='',
placeholder="Label:",
disabled = False,
)
add_label_button_117_004 = widgets.Button(
description='Add label',
disabled=False,
button_style='',
tooltip="Add label in tracer's position",
)
add_label_button_117_004.on_click(add_label_button_clicked)
undo_label_button_117_004 = widgets.Button(
description='Undo',
disabled=False,
button_style='',
tooltip="Remove last added label",
)
undo_label_button_117_004.on_click(undo_label_button_clicked)
# Export buttons
prepare_export_fig_117_003_button = widgets.Button(
description='Export',
disabled=False,
button_style='',
tooltip='',
layout=widgets.Layout(align_self='center')
)
prepare_export_fig_117_003_button.on_click(prepare_export)
prepare_export_fig_117_004_button = widgets.Button(
description='Export',
disabled=False,
button_style='',
tooltip='',
)
prepare_export_fig_117_004_button.on_click(prepare_export)
block_3 = widgets.VBox(
[],
layout=widgets.Layout(align_items='center')
)
block_3.children = [
widgets.HBox([
widgets.VBox([
fig_117_003,
prepare_export_fig_117_003_button,
widgets.HBox([p_slider, p_text])],
layout=widgets.Layout(
height='auto',
)),
widgets.VBox([
fig_117_004,
prepare_export_fig_117_004_button,
widgets.HBox([restart_button, show_all_button]),
],
layout=widgets.Layout(align_items='center')
)
]),
widgets.HBox([
label_input_117_003,
add_label_button_117_003,
undo_label_button_117_003,
widgets.HTML('<div style="width:10px"></div>'),
label_input_117_004,
add_label_button_117_004,
undo_label_button_117_004
]),
]
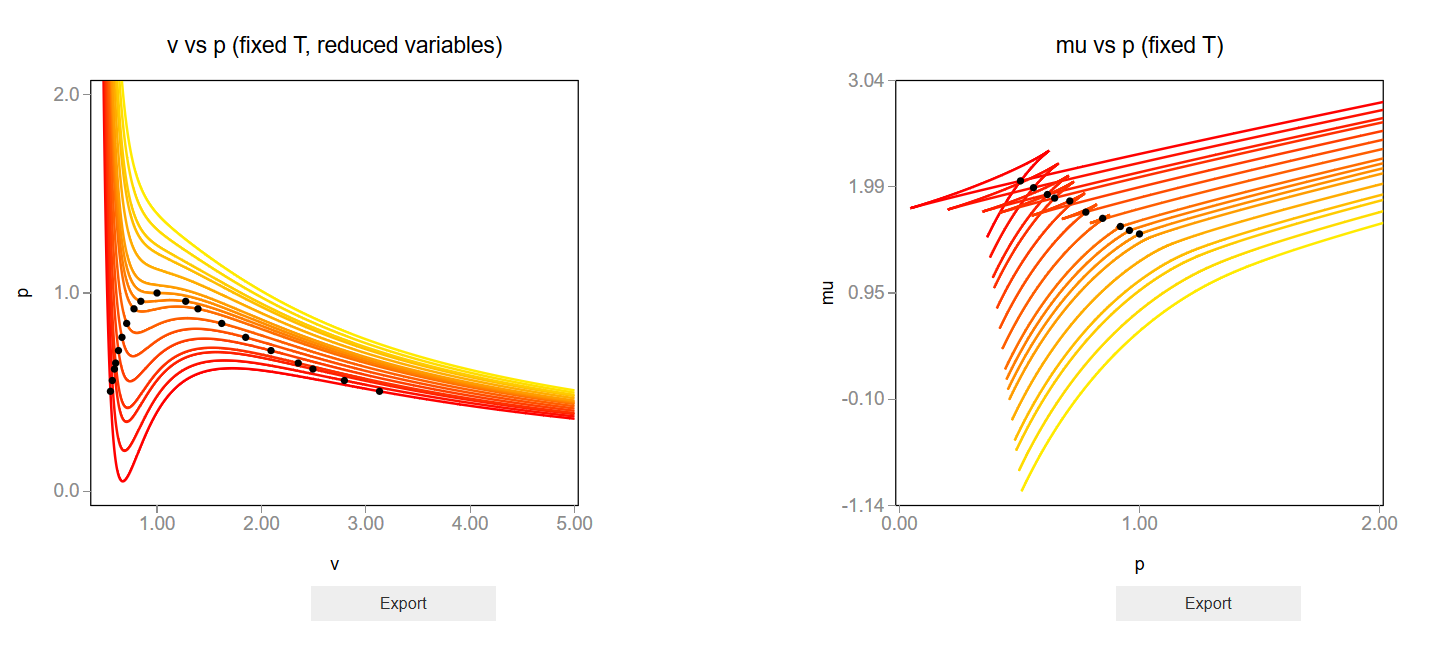
[35]:
################################
######4TH BLOCK#################
################################

block_4 = widgets.HBox(
    [],
    layout=widgets.Layout(
        align_items='center'
    )
)

tt_005 = bq.Tooltip(
    fields = ['y', 'x'],
    formats = ['.3f', '.3f'],
    labels = ['p', 'v']
)

lines_117_005 = bqm.Lines(
    x = v_values,
    y = theo_p_values,
    scales = {'x': scale_x, 'y': scale_y},
    opacities = [1.0],
    visible = True,
    colors = colors,
)

scatter_117_005 = bqm.Scatter(
    name = '',
    x = v_limits,
    y = p_limits,
    scales = {'x': scale_x, 'y': scale_y},
    visible = True,
    colors = ['black'],
    default_size = 15,
    tooltip = tt_005
)

fig_117_005 = Figure(
    title='v vs p (fixed T, reduced variables)',
    marks=[lines_117_005, scatter_117_005],
    axes=[axis_x_001, axis_y_001],
    animation_duration=0, #500,
    legend_location='top-right',
    background_style= {'fill': 'white',  'stroke': 'black'},
    min_aspect_ratio=1.0,
    max_aspect_ratio=1.0,
    fig_margin=dict(top=80, bottom=60, left=70, right=20),
    toolbar = True,
)

# fig_117_006

# Calculate the limits of the plot
max_limit = 0.0
min_limit = 100.0

for pot in mu:
    max_pot = max(pot)
    min_pot = min(pot)

    if max_pot > max_limit:
        max_limit = max_pot

    if min_pot < min_limit:
        min_limit = min_pot

# Calculate the phase transition points in the mu(p, T) plane
trans_mu = []

trans_p = np.unique(p_limits)

for i in range(len(trans_p)):

    p = trans_p[i]
    m = mu[i]

    j = find_nearest_index(theo_p_values_inverted[i], p)

    trans_mu.append(mu[i][j])

scale_x_006 = bqs.LinearScale(min = 0.0, max = 2.0)
scale_y_006 = bqs.LinearScale(min = min_limit, max = max_limit)

axis_x_006 = bqa.Axis(
    scale=scale_x_006,
    tick_format='.2f',
    tick_style={'font-size': '15px'},
    tick_values = [0.0, 1.0, 2.0],
    grid_lines = 'none',
    grid_color = '#8e8e8e',
    label='p',
    label_location='middle',
    label_style={'stroke': 'black', 'default-size': 35},
    label_offset='50px'
)

axis_y_006 = bqa.Axis(
    scale=scale_y_006,
    tick_format='.2f',
    tick_style={'font-size': '15px'},
    num_ticks = 5,
    grid_lines = 'none',
    grid_color = '#8e8e8e',
    orientation='vertical',
    label='mu',
    label_location='middle',
    label_style={'stroke': 'red', 'default_size': 35},
    label_offset='50px'
)


lines_117_006 = bqm.Lines(
    x = [p.tolist() for p in theo_p_values_inverted],
    y = [m.tolist() for m in mu],
    scales = {'x': scale_x_006, 'y': scale_y_006},
    opacities = [1.0],
    visible = True,
    colors = colors,
)

scatter_117_006 = bqm.Scatter(
    name = '',
    x = trans_p,
    y = trans_mu,
    scales = {'x': scale_x_006, 'y': scale_y_006},
    visible = True,
    colors = ['black'],
    default_size = 15,
)

fig_117_006 = Figure(
    title='mu vs p (fixed T)',
    marks=[lines_117_006, scatter_117_006],
    axes=[axis_x_006, axis_y_006],
    animation_duration=0,
    legend_location='top-right',
    background_style= {'fill': 'white',  'stroke': 'black'},
    min_aspect_ratio=1.0,
    max_aspect_ratio=1.0,
    fig_margin=dict(top=80, bottom=60, left=70, right=20),
    toolbar = True,
)

# Export buttons

prepare_export_fig_117_005_button = widgets.Button(
    description='Export',
    disabled=False,
    button_style='',
    tooltip='',
    layout=widgets.Layout(align_self='center')
)

prepare_export_fig_117_005_button.on_click(prepare_export)

prepare_export_fig_117_006_button = widgets.Button(
    description='Export',
    disabled=False,
    button_style='',
    tooltip='',
)

prepare_export_fig_117_006_button.on_click(prepare_export)


block_4.children = [
    widgets.HBox([
        widgets.VBox([
            fig_117_005,
            prepare_export_fig_117_005_button
        ],
        layout=widgets.Layout(
            align_items='center'
        )),
        widgets.VBox([
            fig_117_006,
            prepare_export_fig_117_006_button
        ],
        layout=widgets.Layout(
            align_items='center'
        )),
    ],
        layout=widgets.Layout(
            width='100%',
            align_items='center'
        )
    )
]
[36]:
################################
######5TH BLOCK#################
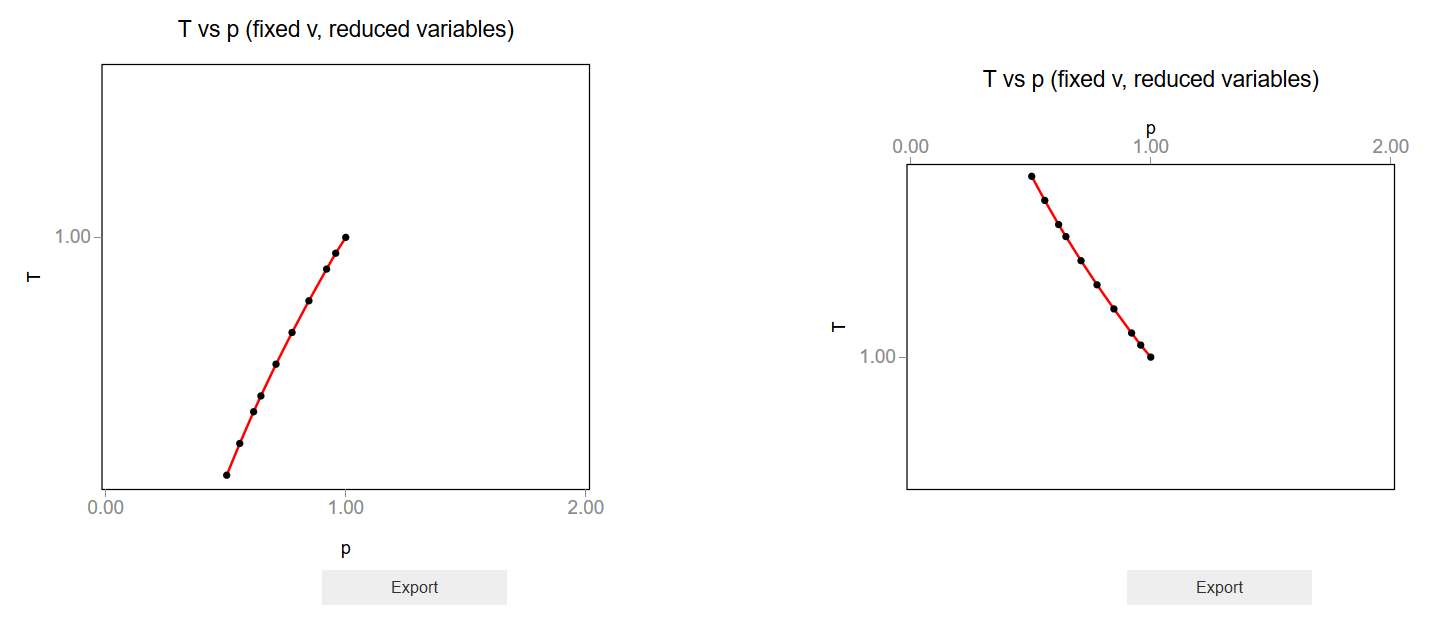
################################
# This block contains the p(T) and T(p) figures
block_5 = widgets.HBox(
[],
layout=widgets.Layout(align_items='center')
)
scale_y_007 = bqs.LinearScale(
min = min(T_values),
max = max(T_values)
)
axis_y_007 = bqa.Axis(
scale=scale_y_007,
tick_format='.2f',
tick_style={'font-size': '15px'},
tick_values = [0.0, 1.0, 2.0],
grid_lines = 'none',
grid_color = '#8e8e8e',
orientation='vertical',
label='T',
label_location='middle',
label_style={'stroke': 'red', 'default_size': 35},
label_offset='50px',
)
tt_007 = bq.Tooltip(
fields = ['y', 'x'],
formats = ['.3f', '.3f'],
labels = ['T', 'p']
)
lines_117_007 = bqm.Lines(
x = trans_p,
y = T_values,
scales = {'x': scale_x_006, 'y': scale_y_007},
opacities = [1.0],
visible = True,
colors = ['red'],
)
scatter_117_007 = bqm.Scatter(
name = '',
x = trans_p,
y = T_values,
scales = {'x': scale_x_006, 'y': scale_y_007},
visible = True,
colors = ['black'],
default_size = 15,
tooltip = tt_007
)
fig_117_007 = Figure(
title='T vs p (fixed v, reduced variables)',
marks=[lines_117_007, scatter_117_007],
axes=[axis_x_006, axis_y_007],
animation_duration=0,
legend_location='top-right',
background_style= {'fill': 'white', 'stroke': 'black'},
min_aspect_ratio=1.0,
max_aspect_ratio=1.0,
fig_margin=dict(top=80, bottom=60, left=70, right=20),
toolbar = True,
)
# fig_117_008
scale_y_008 = bqs.LinearScale(
min = min(T_values),
max = max(T_values),
reverse = True
)
axis_x_008 = bqa.Axis(
scale=scale_x_006,
tick_format='.2f',
tick_style={'font-size': '15px'},
tick_values = [0.0, 1.0, 2.0],
grid_lines = 'none',
grid_color = '#8e8e8e',
label='p',
label_location='middle',
label_style={'stroke': 'black', 'default-size': 35},
label_offset='30px',
side='top'
)
axis_y_008 = bqa.Axis(
scale=scale_y_008,
tick_format='.2f',
tick_style={'font-size': '15px'},
tick_values = [0.0, 1.0, 2.0],
grid_lines = 'none',
grid_color = '#8e8e8e',
orientation='vertical',
label='T',
label_location='middle',
label_style={'stroke': 'red', 'default_size': 35},
label_offset='50px',
)
tt_008 = bq.Tooltip(
fields = ['y', 'x'],
formats = ['.3f', '.3f'],
labels = ['T', 'p']
)
lines_117_008 = bqm.Lines(
x = trans_p,
y = T_values,
scales = {'x': scale_x_006, 'y': scale_y_008},
opacities = [1.0],
visible = True,
colors = ['red'],
)
scatter_117_008 = bqm.Scatter(
name = '',
x = trans_p,
y = T_values,
scales = {'x': scale_x_006, 'y': scale_y_008},
visible = True,
colors = ['black'],
default_size = 15,
tooltip = tt_008
)
fig_117_008 = Figure(
title='T vs p (fixed v, reduced variables)',
marks=[lines_117_008, scatter_117_008],
axes=[axis_x_008, axis_y_008],
animation_duration=0,
legend_location='top-right',
background_style= {'fill': 'white', 'stroke': 'black'},
min_aspect_ratio=1.0,
max_aspect_ratio=1.0,
fig_margin=dict(top=160, bottom=60, left=70, right=20),
toolbar = True,
)
# Export buttons
prepare_export_fig_117_007_button = widgets.Button(
description='Export',
disabled=False,
button_style='',
tooltip='',
layout=widgets.Layout(align_self='center')
)
prepare_export_fig_117_007_button.on_click(prepare_export)
prepare_export_fig_117_008_button = widgets.Button(
description='Export',
disabled=False,
button_style='',
tooltip='',
)
prepare_export_fig_117_008_button.on_click(prepare_export)
block_5.children = [
widgets.HBox([
widgets.VBox([
fig_117_007,
prepare_export_fig_117_007_button
],
layout=widgets.Layout(
align_items='center'
)),
widgets.VBox([
fig_117_008,
prepare_export_fig_117_008_button
],
layout=widgets.Layout(
align_items='center'
)),
],
layout=widgets.Layout(
width='100%',
align_items='center'
)
)
]
[ ]:
###################################
#############MAIN BLOCK############
###################################

main_block_117_000 = widgets.VBox(
    [],
    layout=widgets.Layout(align_items='center')
)

main_block_117_000.children = [
    change_view_button,
    block_1,
    block_2,
    block_3,
    block_4,
    block_5
]

figures = [
    fig_117_001,
    fig_117_002,
    fig_117_003,
    fig_117_004,
    fig_117_005,
    fig_117_006,
    fig_117_007,
    fig_117_008,
]

main_block_117_000