Change in molar entropy during a first-order phase transition
Code: #11D-000
File: apps/van_der_waals/entropy.ipynb
Run it online: ![]()
The aim of this notebook is to visualize the change in molar entropy during a first-orden liquid-gas transition.
Interface
The main interface (main_block_11D_000) is divided in two HBox: top_block_11D_000 and bottom_block_11D_000. bottom_block_11D_000 contains of 2 bqplot Figures: fig_11D_001 and fig_11D_002.
[1]:
from IPython.display import Image
Image(filename='../../static/images/apps/11D-000_1.png')
[1]:
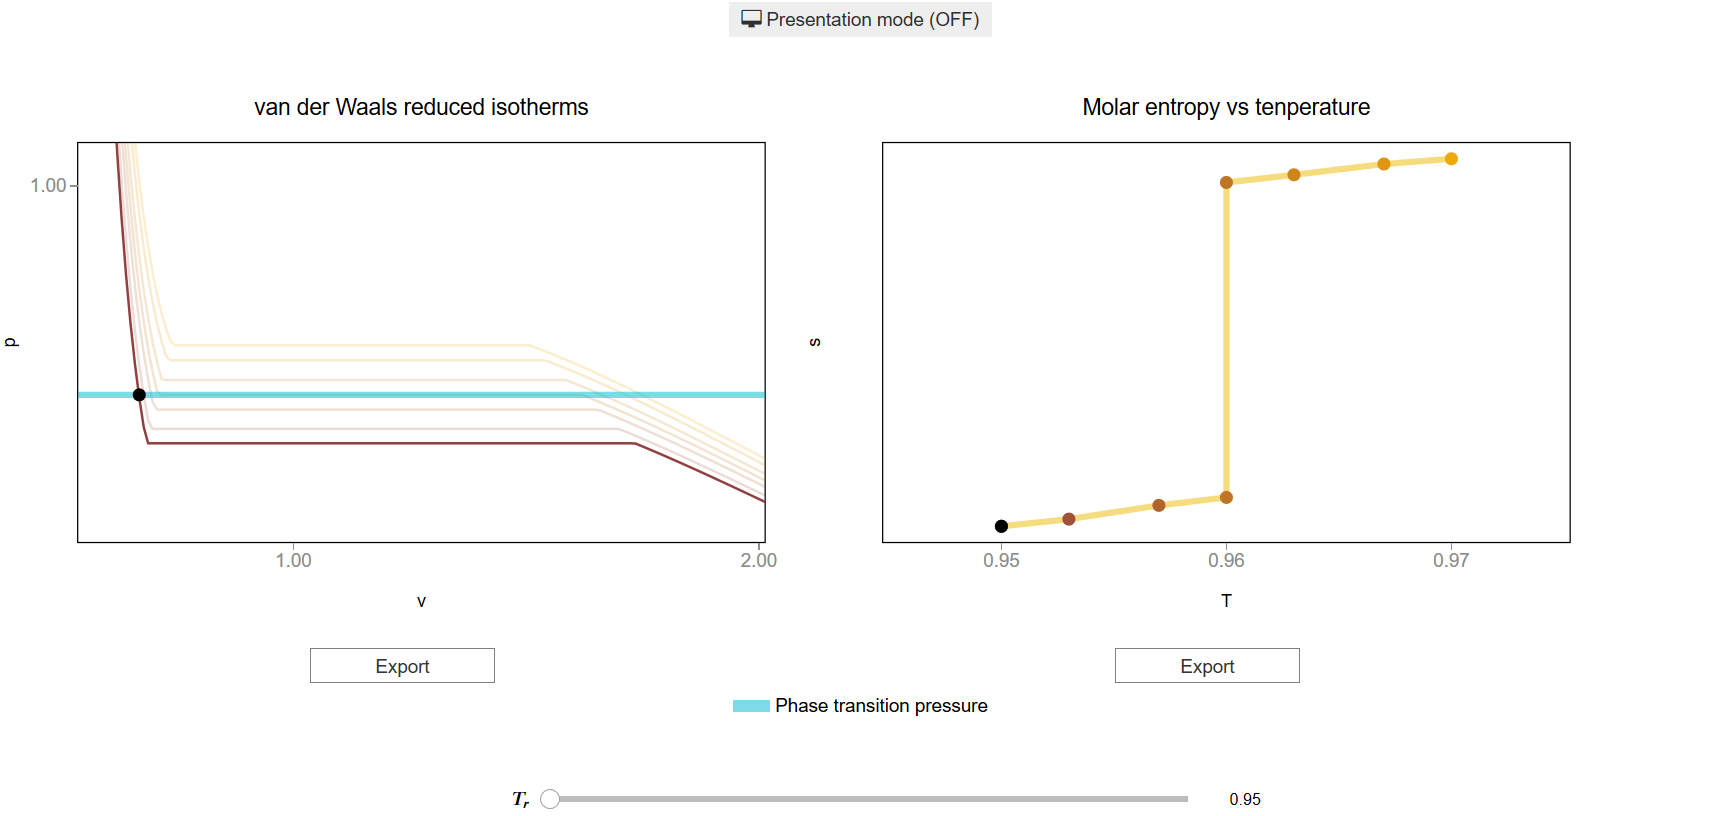
The slider T_slider updates the values of \(T\) which updates the lines and scatter points of fig_11D_001 and fig_11D_002.
[2]:
Image(filename='../../static/images/11D-000_2.png')
[2]:

CSS
A custom css file is used to improve the interface of this application. It can be found here.
[3]:
from IPython.display import HTML
display(HTML("<head><link rel='stylesheet' type='text/css' href='./../../static/custom.css'></head>"))
display(HTML("<style>.container { width:100% !important; } .jupyter-button {white-space: normal !important;}</style>"))
Packages
[4]:
from bqplot import *
import bqplot as bq
import bqplot.marks as bqm
import bqplot.scales as bqs
import bqplot.axes as bqa

import ipywidgets as widgets

from scipy.signal import argrelextrema

import urllib.parse
import webbrowser

import sys
Physical functions
This are the functions that have a physical meaning:
get_relative_isothermsexperimetal_isothermsget_rootsp_indefinite_integralp_definite_integralfind_real_fixed_pfind_real_fixed_T
[5]:
def get_relative_isotherms(v_range, T_range):
    """This function calculates the theoretical p(v, T) plane
        (in reduced coordinates) according to van der Waals
        equation of state from a given range of volumes
        and tenperatures.

    Args:
        v_range: An array containing the values of v
        (in reduced coordinates)for which the isotherms must be
        calculated.\n
        T_range: An array containing the values of T
        (in reduced coordinates)for which the isotherms must be
        calculated.\n


    Returns:
        isotherms: A list consisted of numpy arrays containing the
        pressures of each isotherm.
    """

    isotherms = []

    for T in T_range:
        p_R = []
        for v in v_range:
            val = (8.0/3.0*T/(v - 1.0/3.0) - 3.0/v**2)
            p_R = np.append(p_R, val)

        isotherms.append(p_R)

    return isotherms
[6]:
def experimental_isotherms(p_range, v_range, T_range, fixed_p, fixed_T):
    """This function calculates the experimental p(v, T) plane
        (in reduced coordinates) according to van der Waals
        equation of state for a given range of volumes
        and tenperatures or for a given range of volumes
        and pressures.

    Args:
        p_range: An array containing the values of p
        (in reduced coordinates)for which the isotherms must be
        calculated. Only used if fixed_p == True.\n
        v_range: An array containing the values of v
        (in reduced coordinates)for which the isotherms must be
        calculated.\n
        T_range: An array containing the values of v
        (in reduced coordinates)for which the isotherms must be
        calculated. Only used if fixed_T == True.\n
        fixed_p: Boolean variable which represents if the isotherms
        must be calculated for a given pressures.\n
        fixed_T: Boolean variable which represents if the isotherms
        must be calculated for a given pressures.\n


    Returns:
        expe_data: A list consisted of numpy arrays containing the
        pressures of each theoretical isotherm.\n
        theo_data: A list consisted of numpy arrays containing the
        pressures of each theoretical isotherm.\n
        v_limits: A list consisted of arrays of the volume limits of
        the phase-transition of each subcritical isotherm.\n
        p_limits: A list consisted of arrays of the pressure limits of
        the phase-transition of each subcritical isotherm.\n
        tenperatures: A list consisted of the tenperatures of the
        isotherms.\n
    """

    if fixed_T:

        theo_data = get_relative_isotherms(v_range, T_range)
        expe_data = []

        v_limits = []
        p_limits = []

        p_range = np.linspace(0.001, 1.0, num=10000)
        pressures, v_isobaric_limits = find_real_fixed_T(p_range, T_range)

        for i in range(len(theo_data)):

            p_expe = []

            if i < len(v_isobaric_limits):

                    v_lim = v_isobaric_limits[i]

                    if len(v_lim) > 1: #check if there is only one point
                        for j in range(len(v_range)):

                            if v_range[j] > v_lim[0] and v_range[j] < v_lim[1]:
                                p_expe.append(pressures[i])

                            else:
                                p_expe.append(theo_data[i][j])

                        v_limits = np.append(v_limits, [v_lim[0], v_lim[1]])
                        p_limits = np.append(p_limits, [pressures[i], pressures[i]])

                    else:
                        p_expe = theo_data[i]
                        v_limits = np.append(v_limits, [1.0])
                        p_limits = np.append(p_limits, [1.0])

            else:

                p_expe = theo_data[i]

            expe_data.append(p_expe)

        tenperatures = T_range

        return expe_data, theo_data, p_limits, v_limits, tenperatures

    elif fixed_p:

        tenperatures, v_isobaric_limits = find_real_fixed_p(p_range, T_range)

        theo_data = get_relative_isotherms(v_range, tenperatures)
        expe_data = []

        v_limits = []
        p_limits = []

        for i in range(len(theo_data)):

            p_expe = []

            if i < len(v_isobaric_limits):

                    v_lim = v_isobaric_limits[i]

                    if len(v_lim) > 1: #check if there is only one point

                        for j in range(len(v_range)):

                            if v_range[j] > v_lim[0] and v_range[j] < v_lim[1]:
                                p_expe.append(p_range[i])

                            else:
                                p_expe.append(theo_data[i][j])

                        v_limits = np.append(
                            v_limits,
                            [v_lim[0],
                             v_lim[1]]
                        )
                        p_limits = np.append(
                            p_limits,
                            [p_range[i],
                             p_range[i]]
                        )

                    else:
                        p_expe = theo_data[i]
                        v_limits = np.append(v_limits, [1.0])
                        p_limits = np.append(p_limits, [1.0])

            else:

                p_expe = theo_data[i]

            expe_data.append(p_expe)

        return expe_data, theo_data, p_limits, v_limits, tenperatures
[7]:
def get_roots(p, T):
    """This function calculates the roots of a van der Waals
    isotherm of a given T and set of pressures.

    Args:
        p: Numpy array consisted of the pressures of the isotherm.\n
        T: Value of the tenperature.\n

    Returns:
        roots_in_range: A list consisted of the real roots.\n
    """


    roots = np.roots([1.0, - 1.0/3.0*(1.0 + 8.0*T/p), 3.0/p, -1.0/p])
    roots_in_range = []

    for root in roots:
        if np.isreal(root):
            root = np.real(root)
            if root > 0:
                roots_in_range.append(root)
    roots_in_range.sort()

    return roots_in_range
[8]:
def p_indefinite_integral(p_0, v_0, T):
    """This function calculates the indefinite integral between
    a van der Waals isotherm and a isobaric line.

    Args:
        p0: Isobaric line's pressure.\n
        v0: Value of the volume.\n
        T: Value of the tenperature.\n

    Returns:
        integral: Value of the indefinite integral between a
        van der Waals isotherm at T and a isobaric line of p0 at a
        volume v0.\n
    """

    integral = 8.0/3.0 * T *np.log(v_0 - 1.0/3.0) + 3.0/v_0 - p_0*v_0

    return integral
[9]:
def definite_integral(p_0, v_range, T):
    """This function 'p_indefinite_integral' function to calculate
    the definite integral between a van der Waals isotherm and a
    isobaric line.

    Args:
        p0: Isobaric line's pressure.\n
        v_range: Tuple or list consisted of volume limits.\n
        T: Value of the tenperature.\n

    Returns:
        integral: Value of the definite integral between a
        van der Waals isotherm at T and a isobaric line of p0 in a
        volume range v_range.\n
    """

    v_0, v_1 = v_range[0], v_range[1]

    integral = p_indefinite_integral(p_0, v_1, T) - p_indefinite_integral(p_0, v_0, T)

    return integral
[10]:
def find_real_fixed_T(p_values, T_values):
    """This function uses Maxwell's construction to find the
       pressures in which phase transition happens given some
       fixed tenperatures.\n

    Args:
        p_values: List of pressures in which the real isotherm is
        searched.\n
        T_values: List of tenperatures of the isotherms.\n


    Returns:
        pressures: List of pressures in which phase transition
        happens.\n
        v_range: Volume limits of phase transition zones.
    """

    eps = 1e-3

    pressures = []
    v_ranges = []

    for T in T_values:

        if T < 1.0:

            for p in p_values:

                roots = get_roots(p, T)

                if len(roots) == 3:

                    v_range = [roots[0], roots[2]]
                    area = definite_integral(p, v_range, T)

                    if abs(area) < eps:

                        pressures.append(p)
                        v_ranges.append(v_range)

                        break

        elif T == 1.0:

            pressures.append(1.0)
            v_ranges.append([1.0])

    return pressures, v_ranges
[11]:
def find_real_fixed_p(p_values, T_values):
    """This function uses Maxwell's construction to find the
       tenperatures in which phase transition happens given some
       fixed pressures.\n

    Args:
        p_values: List of pressures of the isotherms.\n
        T_values: List of tenperatures in which the real isotherm is
        searched.\n


    Returns:
        tenperatures: List of tenperatures in which phase transition
        happens.\n
        v_range: Volume limits of phase transition zones.
    """

    eps = 1e-3

    tenperatures = []
    v_ranges = []

    for p in p_values:

        if p < 1.0:

            for T in T_values:

                roots = get_roots(p, T)

                if len(roots) == 3:

                    v_range = [roots[0], roots[2]]
                    area = definite_integral(p, v_range, T)

                    if abs(area) < eps:

                        tenperatures.append(T)
                        v_ranges.append(v_range)

                        break

        elif p == 1.0:

            tenperatures.append(1.0)
            v_ranges.append([1.0])

    return tenperatures, v_ranges
[12]:
def get_entropy(v_values):
    """This function calculates the entropy for a given
    array of molar volumes.

    Args:
        v_values: Array consisted of the values of molar volume.

    Returns:
        s: Array containing the values of the entropy.
    """
    v_values = np.asarray(v_values)
    s = 8.0/3.0*np.log(3.0*v_values - 1.0)

    return s
Main interface
[ ]:
T_values = np.round(np.linspace(0.95, 0.97, 7), 3)
v_values = np.linspace(0.45, 5.2, 500)

colors = generate_gradient('#914040', '#feb901', len(T_values))

def_op = 0.2
opacities = [def_op for T in T_values]
opacities[0] = 1.0

data = experimental_isotherms(
    p_range=[],
    v_range=v_values,
    T_range=T_values,
    fixed_T = True,
    fixed_p = False
)

expe_p_values = data[0]
theo_p_values = data[1]

p_limits = data[2]
v_limits = data[3]
T_limits = data[4]

# The index of the pressure of the selected isotherm
selected = 3

p_0 = np.unique(p_limits)[selected]

state_v = []
T_values_repeated = []
colors_repeated = []

for i in range(len(T_values)):

    if i == selected:

        state_v.append(
            np.array([v_limits[2*i],v_limits[2*i+1]])
        )

        T_values_repeated.append(
            T_values[i]
        )

        colors_repeated.append(colors[i])

    else:

        idx = find_nearest_index(expe_p_values[i], p_0)
        state_v.append(v_values[idx])

    T_values_repeated.append(
        T_values[i]
    )

    colors_repeated.append(colors[i])

s_values = []

for v in state_v:
    s_values.append(get_entropy(v))

s_values_plain = np.hstack(s_values)

##########################
########TOP BLOCK#########
##########################

top_block_11D_000 = widgets.HBox(
    [],
    layout=widgets.Layout(
        align_items='center',
        width='100%'
    )
)

# fig_11D_001

scale_x_11D_001 = bqs.LinearScale(min = 0.55, max = 2.0)
scale_y_11D_001 = bqs.LinearScale(min = 0.75, max = 1.02)

axis_x_11D_001 = bqa.Axis(
    scale=scale_x_11D_001,
    tick_format='0.2f',
    tick_style={'font-size': '15px'},
    tick_values=[1.0, 2.0, 3.0, 4.0, 5.0],
    grid_lines = 'none',
    grid_color = '#8e8e8e',
    label='v',
    label_location='middle',
    label_style={'stroke': 'black', 'default-size': 35},
    label_offset='50px'
)

axis_y_11D_001 = bqa.Axis(
    scale=scale_y_11D_001,
    tick_format='0.2f',
    tick_style={'font-size': '15px'},
    tick_values=[0.0, 1.0],
    grid_lines = 'none',
    grid_color = '#8e8e8e',
    orientation='vertical',
    label='p',
    label_location='middle',
    label_style={'stroke': 'red', 'default_size': 35},
    label_offset='50px'
)

isotherms = bqm.Lines(
    x = np.array([v_values]),
    y = np.array([expe_p_values]),
    scales = {'x': scale_x_11D_001, 'y': scale_y_11D_001},
    opacities = opacities,
    visible = True,
    colors = colors,
    labels = [str(t) for t in T_limits],
)

isobaric = bqm.Lines(
    x = [v_values[0], v_values[-1]],
    y = np.array([p_0, p_0]),
    scales = {'x': scale_x_11D_001, 'y': scale_y_11D_001},
    opacities = [0.5],
    visible = True,
    colors = ['#01b6cf'],
    stroke_width = 5,
)

state = bqm.Scatter(
    x = [state_v[0]],
    y = [p_0],
    scales = {'x': scale_x_11D_001, 'y': scale_y_11D_001},
    visible = True,
    colors = ['black'],
    names = [],
    #tooltip = tt
)

fig_11D_001 = bq.Figure(
    title='van der Waals reduced isotherms',
    marks=[],
    axes=[axis_x_11D_001, axis_y_11D_001],
    animation_duration=0,
    layout = widgets.Layout(
        align_self='center',
    ),
    legend_location='top-right',
    background_style= {'fill': 'white','stroke': 'black'},
    fig_margin=dict(top=80,bottom=80,left=60,right=30),
    toolbar = True
)

fig_11D_001.marks = [
    isotherms,
    isobaric,
    state
]

# fig_11D_002

scale_x_11D_002 = bqs.LinearScale(min=0.945, max=0.975)
scale_y_11D_002 = bqs.LinearScale()

axis_x_11D_002 = bqa.Axis(
    scale=scale_x_11D_002,
    tick_format='0.2f',
    tick_style={'font-size': '15px'},
    tick_values=[0.95, 0.96, 0.97],
    grid_lines = 'none',
    grid_color = '#8e8e8e',
    label='T',
    label_location='middle',
    label_style={'stroke': 'black', 'default-size': 35},
    label_offset='50px'
)

axis_y_11D_002 = bqa.Axis(
    scale=scale_y_11D_002,
    tick_format='0.2f',
    tick_style={'font-size': '15px'},
    num_ticks=0,
    grid_lines = 'none',
    grid_color = '#8e8e8e',
    orientation='vertical',
    label='s',
    label_location='middle',
    label_style={'stroke': 'red', 'default_size': 35},
    label_offset='50px'
)

entropy_line = bqm.Lines(
    x = T_values_repeated,
    y = s_values_plain,
    scales = {'x': scale_x_11D_002, 'y': scale_y_11D_002},
    opacities = [0.5],
    visible = True,
    colors = ['#edba00'],
    labels = [str(t) for t in T_limits],
    stroke_width = 5,
)

entropy_scatter = bqm.Scatter(
    x = T_values_repeated,
    y = s_values_plain,
    scales = {'x': scale_x_11D_002, 'y': scale_y_11D_002},
    opacities = opacities,
    visible = True,
    colors = colors_repeated,
    labels = [str(t) for t in T_limits],
)

state_s = bqm.Scatter(
    x = [T_values[0]],
    y = [s_values_plain[0]],
    scales = {'x': scale_x_11D_002, 'y': scale_y_11D_002},
    visible = True,
    colors = ['black'],
    names = [],
)

fig_11D_002 = bq.Figure(
    title='Molar entropy vs tenperature',
    marks=[],
    axes=[axis_x_11D_002, axis_y_11D_002],
    animation_duration=0,
    layout = widgets.Layout(
        align_self='center',
    ),
    legend_location='top-right',
    background_style= {'fill': 'white','stroke': 'black'},
    fig_margin=dict(top=80,bottom=80,left=60,right=30),
    toolbar = True
)

fig_11D_002.marks = [
    entropy_line,
    entropy_scatter,
    state_s
]

prepare_export_fig_11D_001_button = widgets.Button(
    description='Export',
    disabled=False,
    button_style='',
    tooltip='',
    layout = widgets.Layout(
        align_self='center'
    )
)

prepare_export_fig_11D_001_button.on_click(prepare_export)

prepare_export_fig_11D_002_button = widgets.Button(
    description='Export',
    disabled=False,
    button_style='',
    tooltip='',
    layout = widgets.Layout(
        align_self='center'
    )
)

prepare_export_fig_11D_002_button.on_click(prepare_export)

top_block_11D_000.children = [
    widgets.VBox([
        fig_11D_001,
        prepare_export_fig_11D_001_button
    ]),
    widgets.VBox([
        fig_11D_002,
        prepare_export_fig_11D_002_button
    ])
]

bottom_block_11D_000 = widgets.VBox(
    [],
    layout=widgets.Layout(
        align_items='center',
        width='100%'
    )
)

isobaric_line =  widgets.HTML(
    value="<div style='width:30px;text-align:left;display:inline-block;" \
          + "border: 5px solid #01b6cf;opacity: 0.5'> </div>" \
          + "  Phase transition pressure"
)

T_slider = widgets.SelectionSlider(
    options=T_values,
    value=T_values[0],
    description=r'\( T_r \)',
    disabled=False,
    continuous_update=True,
    orientation='horizontal',
    readout=True,
    layout = widgets.Layout(
        width = '50%',
        margin = '45px 0 0 0'
    )
)

T_slider.observe(change_tenperature, 'value')

bottom_block_11D_000.children = [
    isobaric_line,
    T_slider
]

change_view_button = widgets.ToggleButton(
    value=False,
    description='Presentation mode (OFF)',
    disabled=False,
    button_style='',
    tooltip='',
    icon='desktop',
    layout=widgets.Layout(
        width='initial',
        align_self='center'
    )
)

change_view_button.observe(change_view, 'value')

main_block_11D_000 = widgets.VBox(
    [],
    layout=widgets.Layout(
        align_items='center',
        width='100%'
    )
)

main_block_11D_000.children = [
    change_view_button,
    top_block_11D_000,
    bottom_block_11D_000,
]

figures = [
    fig_11D_001,
    fig_11D_002
]

main_block_11D_000